53.00 H²EPRScore
The leading system still leaves substantial headroom on complete event-process reconstruction.
An evidence-traceable benchmark for event-process reconstruction.
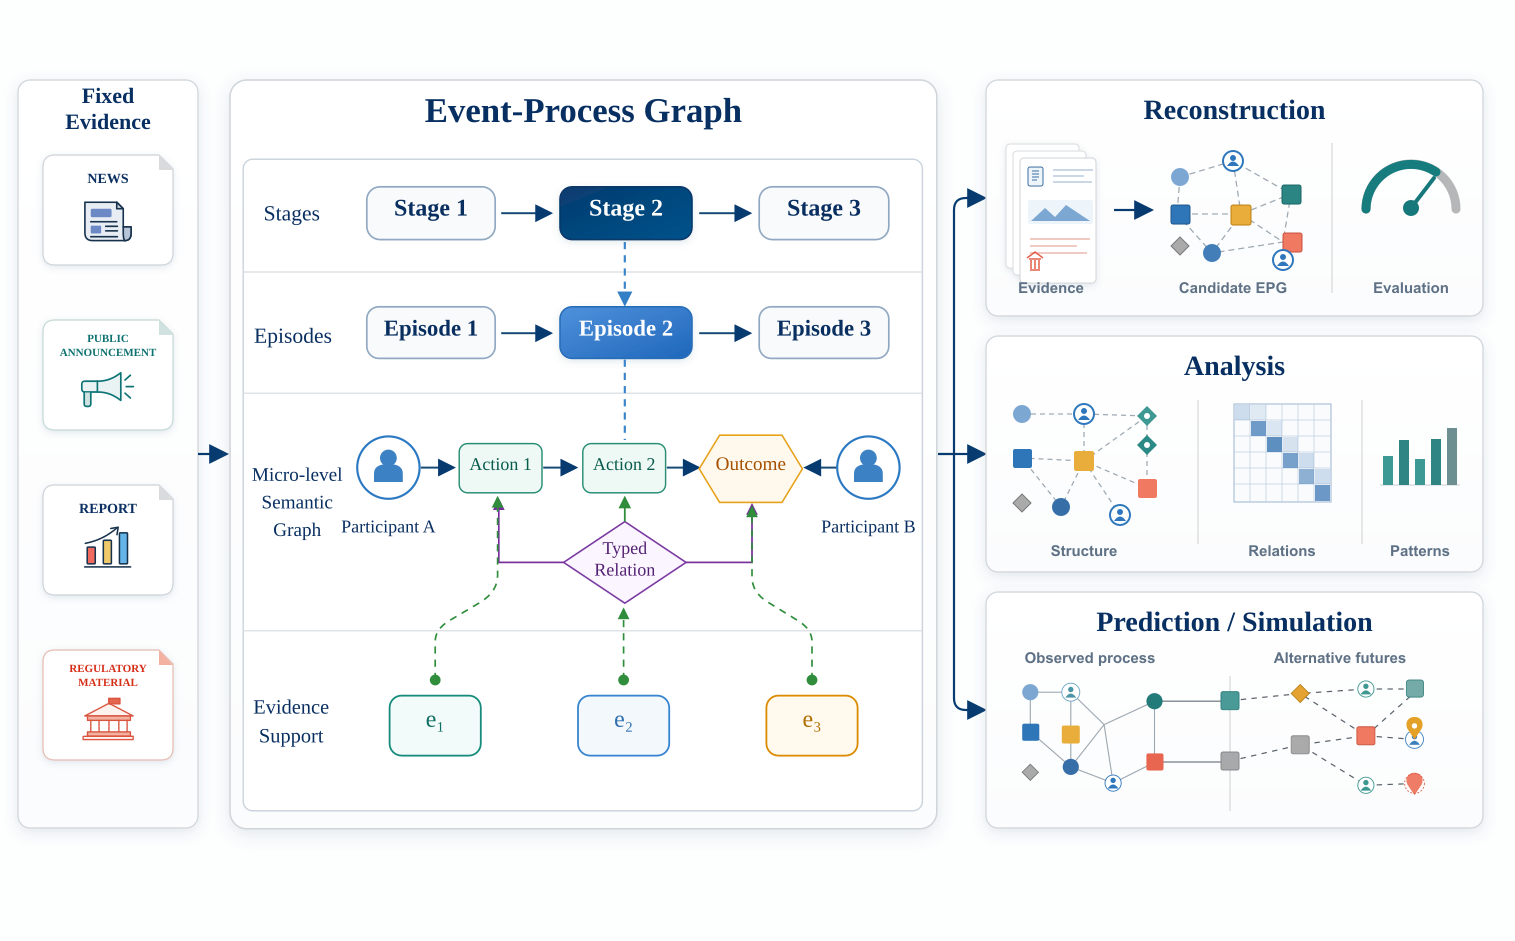
Given the same fixed, multi-source evidence, can a model reconstruct how a complex event actually unfolded? H²EPR-Bench evaluates the process structure behind the facts.
The leading system still leaves substantial headroom on complete event-process reconstruction.
Source attribution and stage-order scores exceed 82, showing that models often identify the right material.
Action–outcome, causal, and explicit temporal relations are much harder to reconstruct.
Mediated mechanism paths are rarely preserved, pinpointing the gap between event facts and event logic.
Real-world events are not static text objects. They unfold through stages, actors, actions, dependencies, outcomes, and evidence distributed across sources. Evaluating whether a model understands such events therefore requires more than summaries, timelines, or isolated extraction targets.
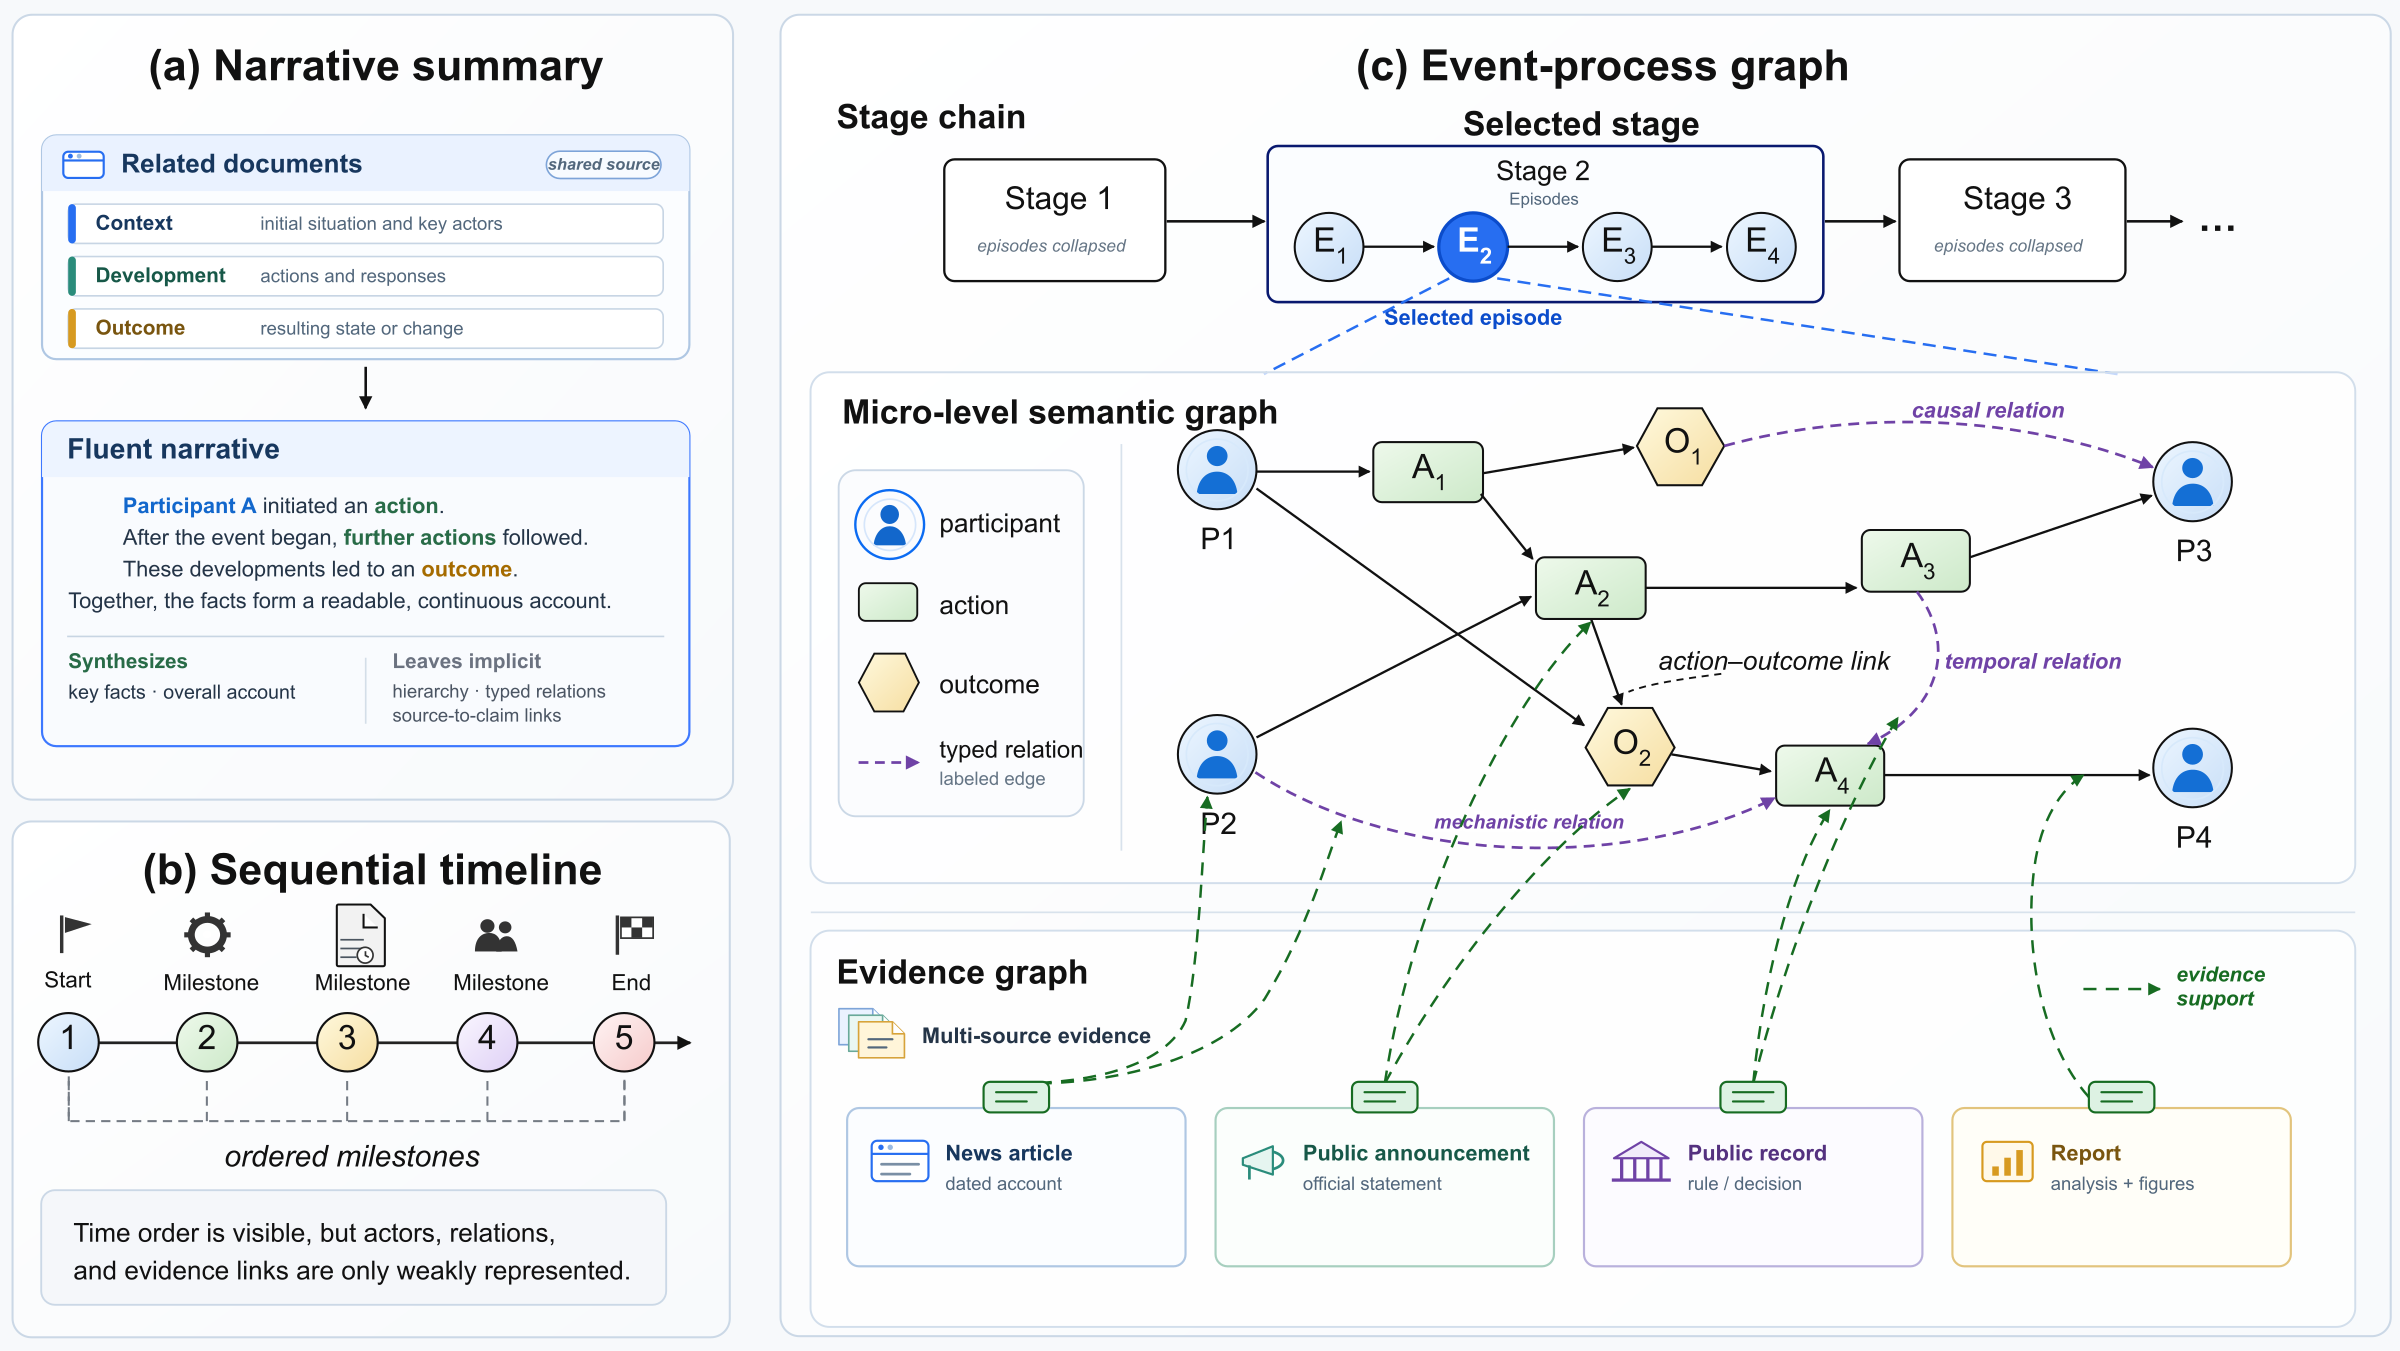
Event-process graphs keep stage order, actor interactions, operations, relations, and evidence links visible in the same representation.
This turns event understanding into a structured reconstruction problem rather than a single text-generation target.
H²EPR-Bench treats events as structured process objects. Starting from fixed evidence contexts, each event is represented as a hierarchical heterogeneous Event-Process Graph that makes stage progression, actor interactions, temporal dependencies, action-result logic, and evidence links explicit.
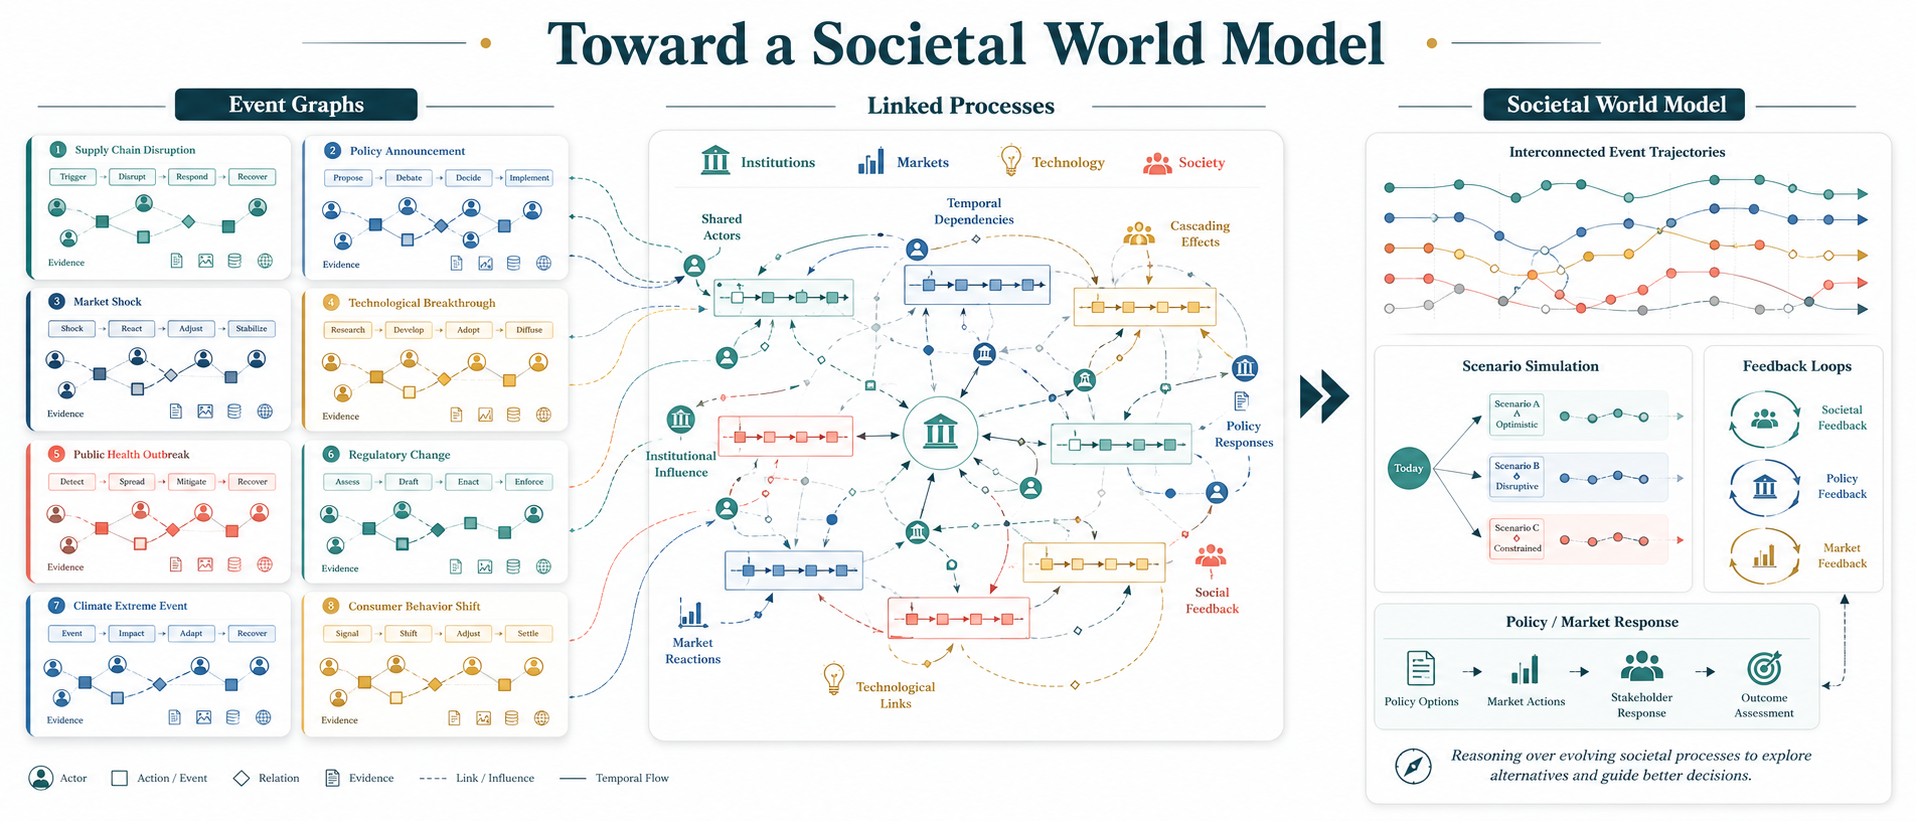
H²EPR-Bench centers on reconstruction, while the EPG representation also creates a common substrate for cross-event analysis, continuation, prediction, and simulation research.
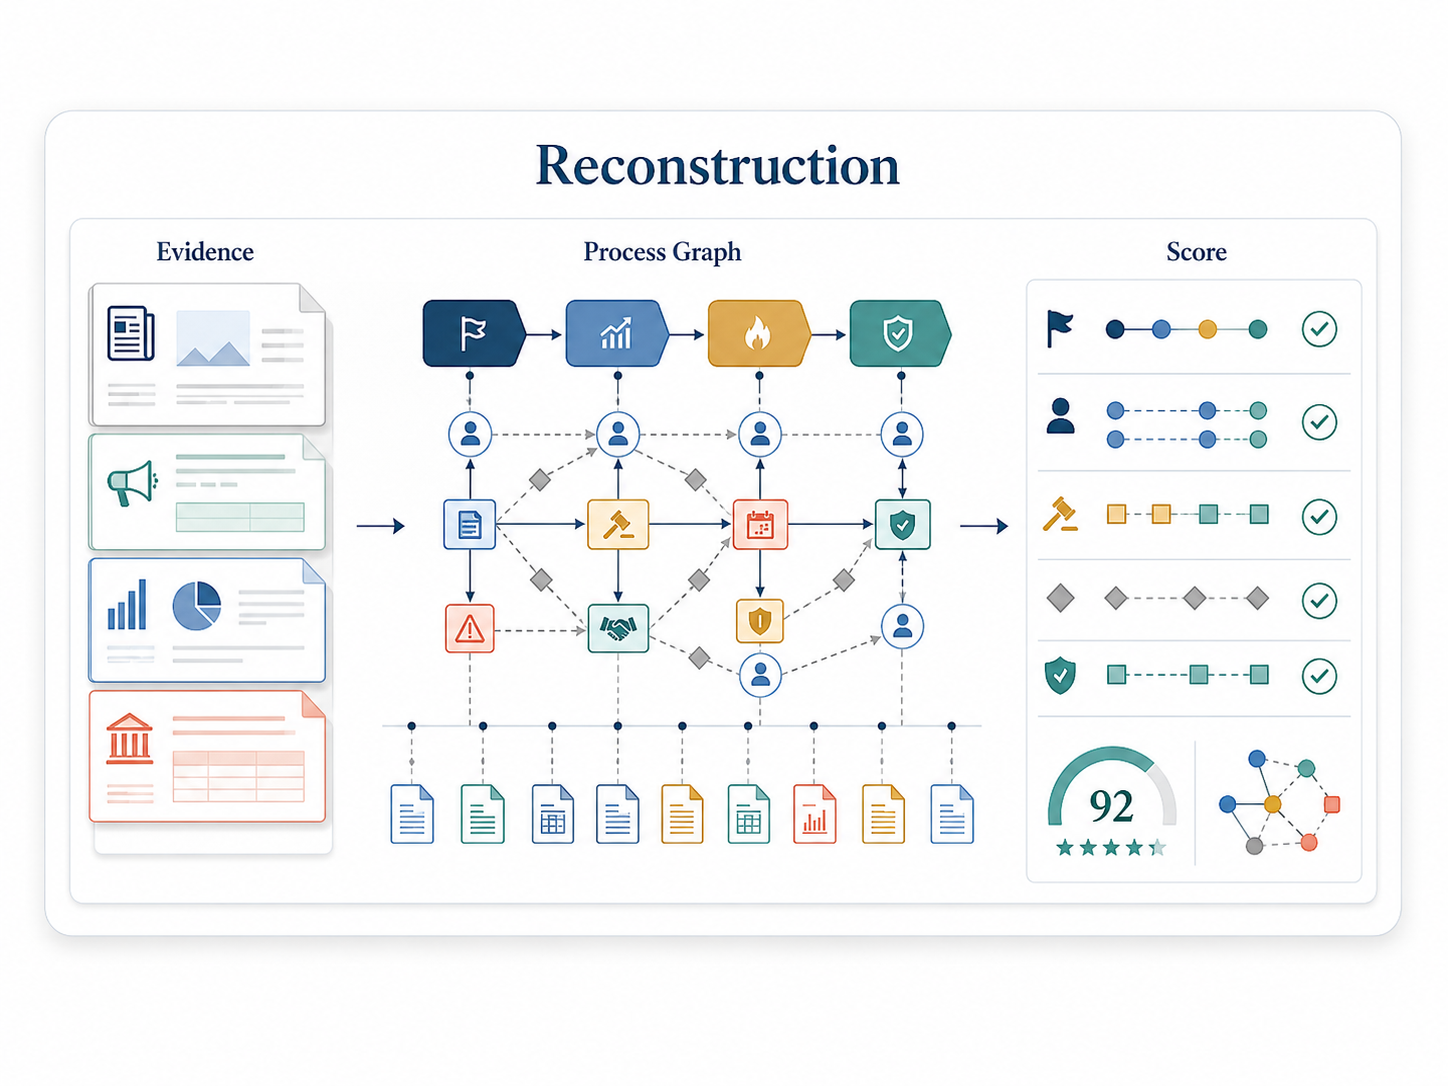
Each system receives an event descriptor and the same fixed evidence package, then returns a structured Event-Process Graph.
Agent–expert review, human adjudication, and final sign-off produce one consistent medium-granularity reference EPG per event.
The target representation connects macro stages, meso episodes, micro-level participants, actions, outcomes, relations, and evidence support.
Evaluation reports structural, temporal, causal, and evidence fidelity, together with a unified H²EPRScore.
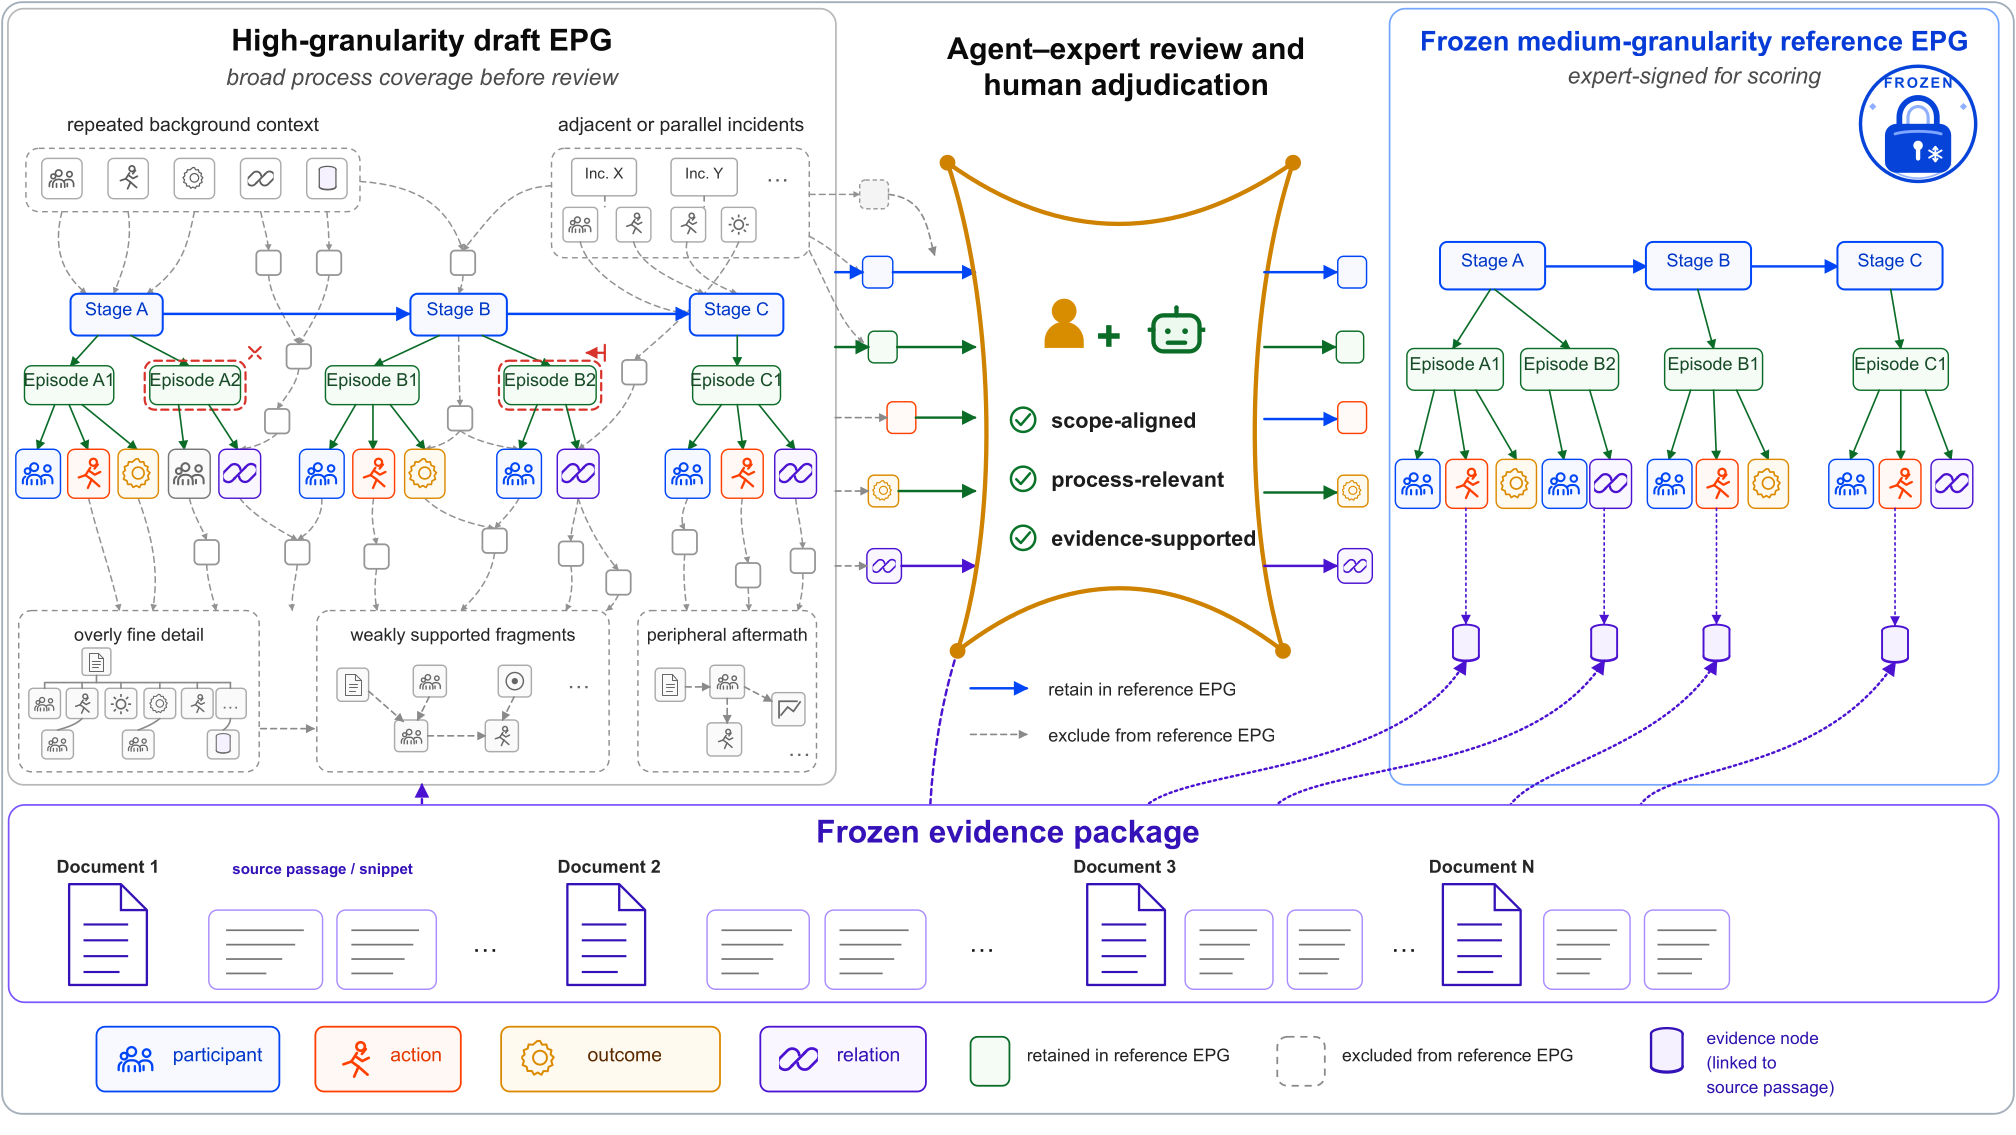
FinMycelium enables graph construction at scale; expert review then aligns scope, process relevance, and evidence support before each reference EPG is finalized.
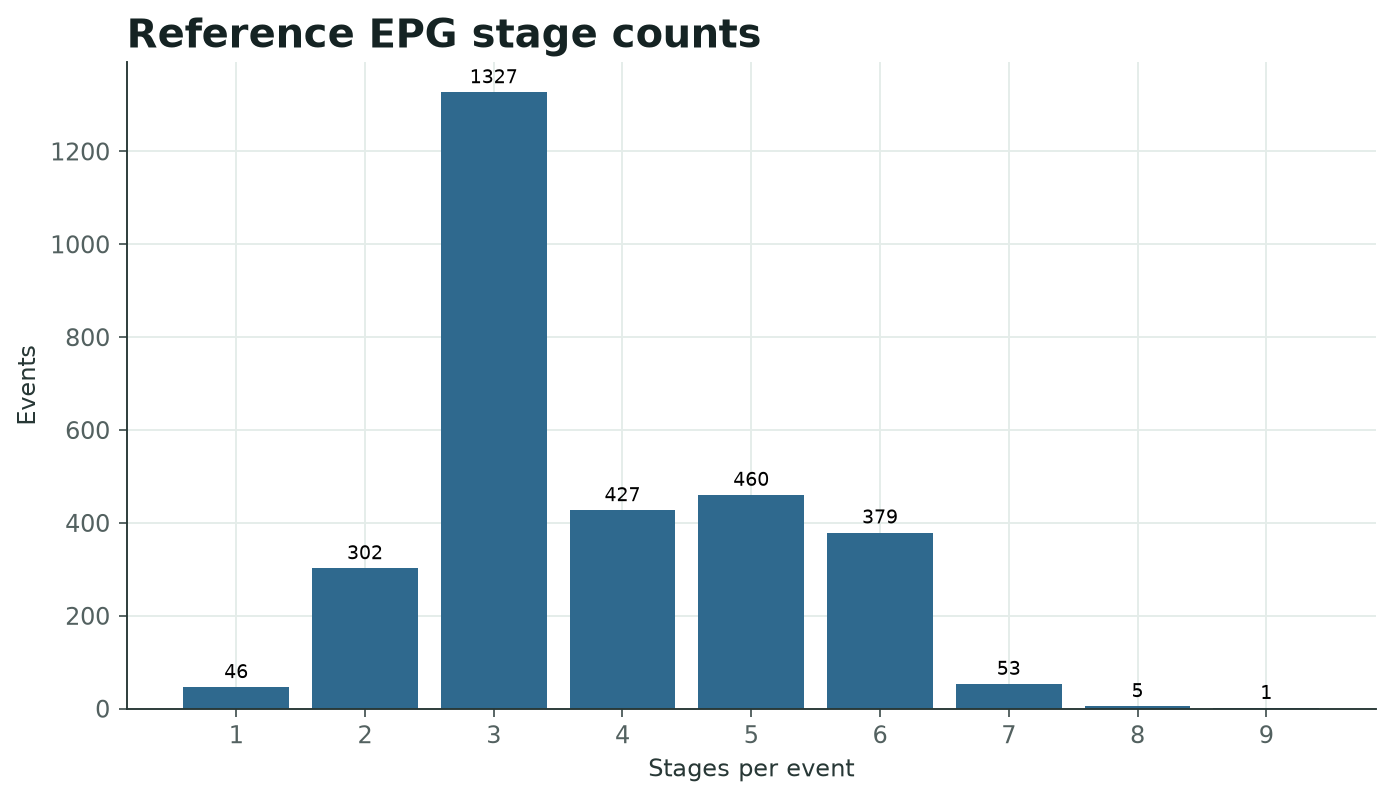
H²EPR-Bench covers 3,000 events from 1629 to 2025 across six domains and twenty-six categories. Its evidence packages retain 25,814 verified documents from 84,693 retrieved source records, with every artifact aligned by a stable event ID.
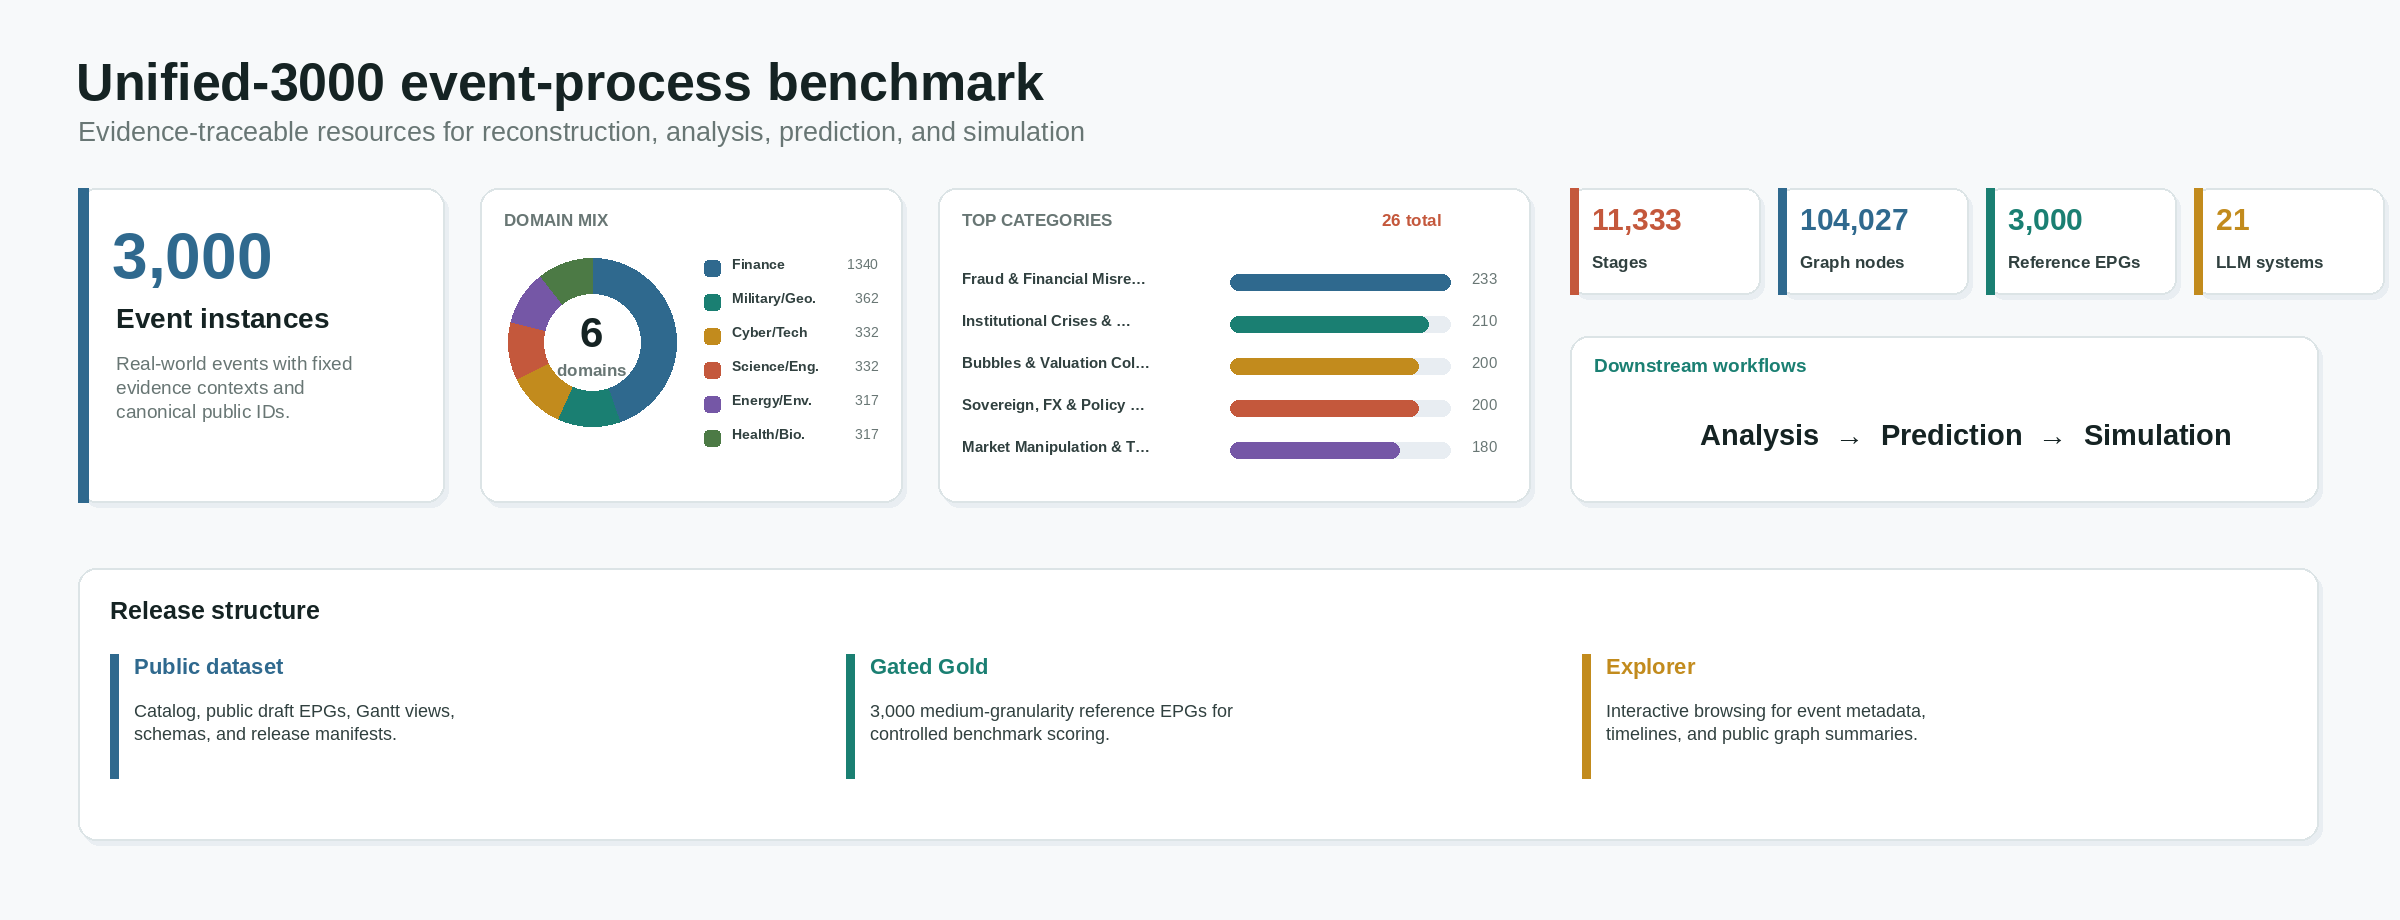
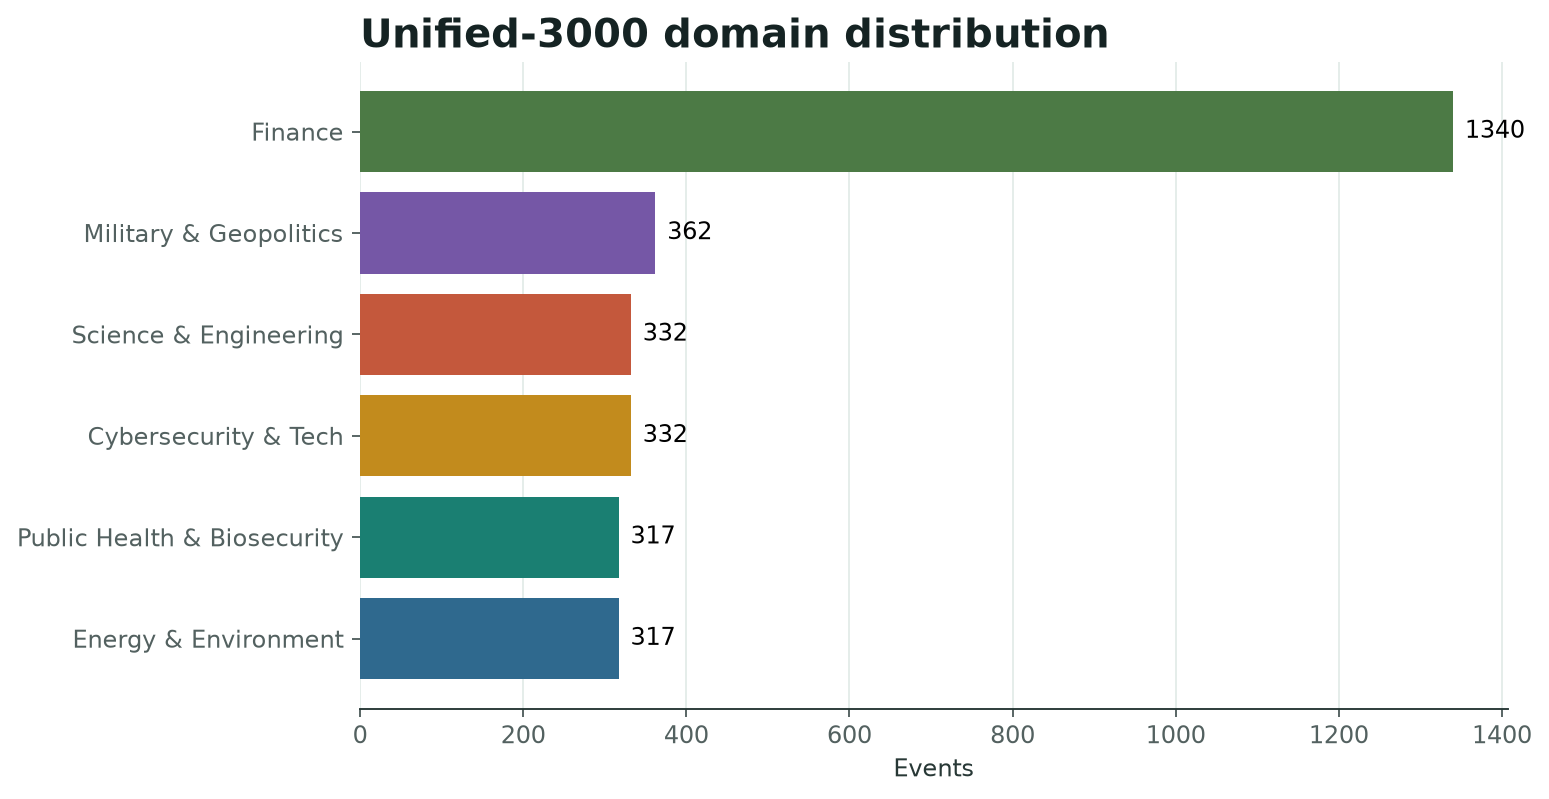
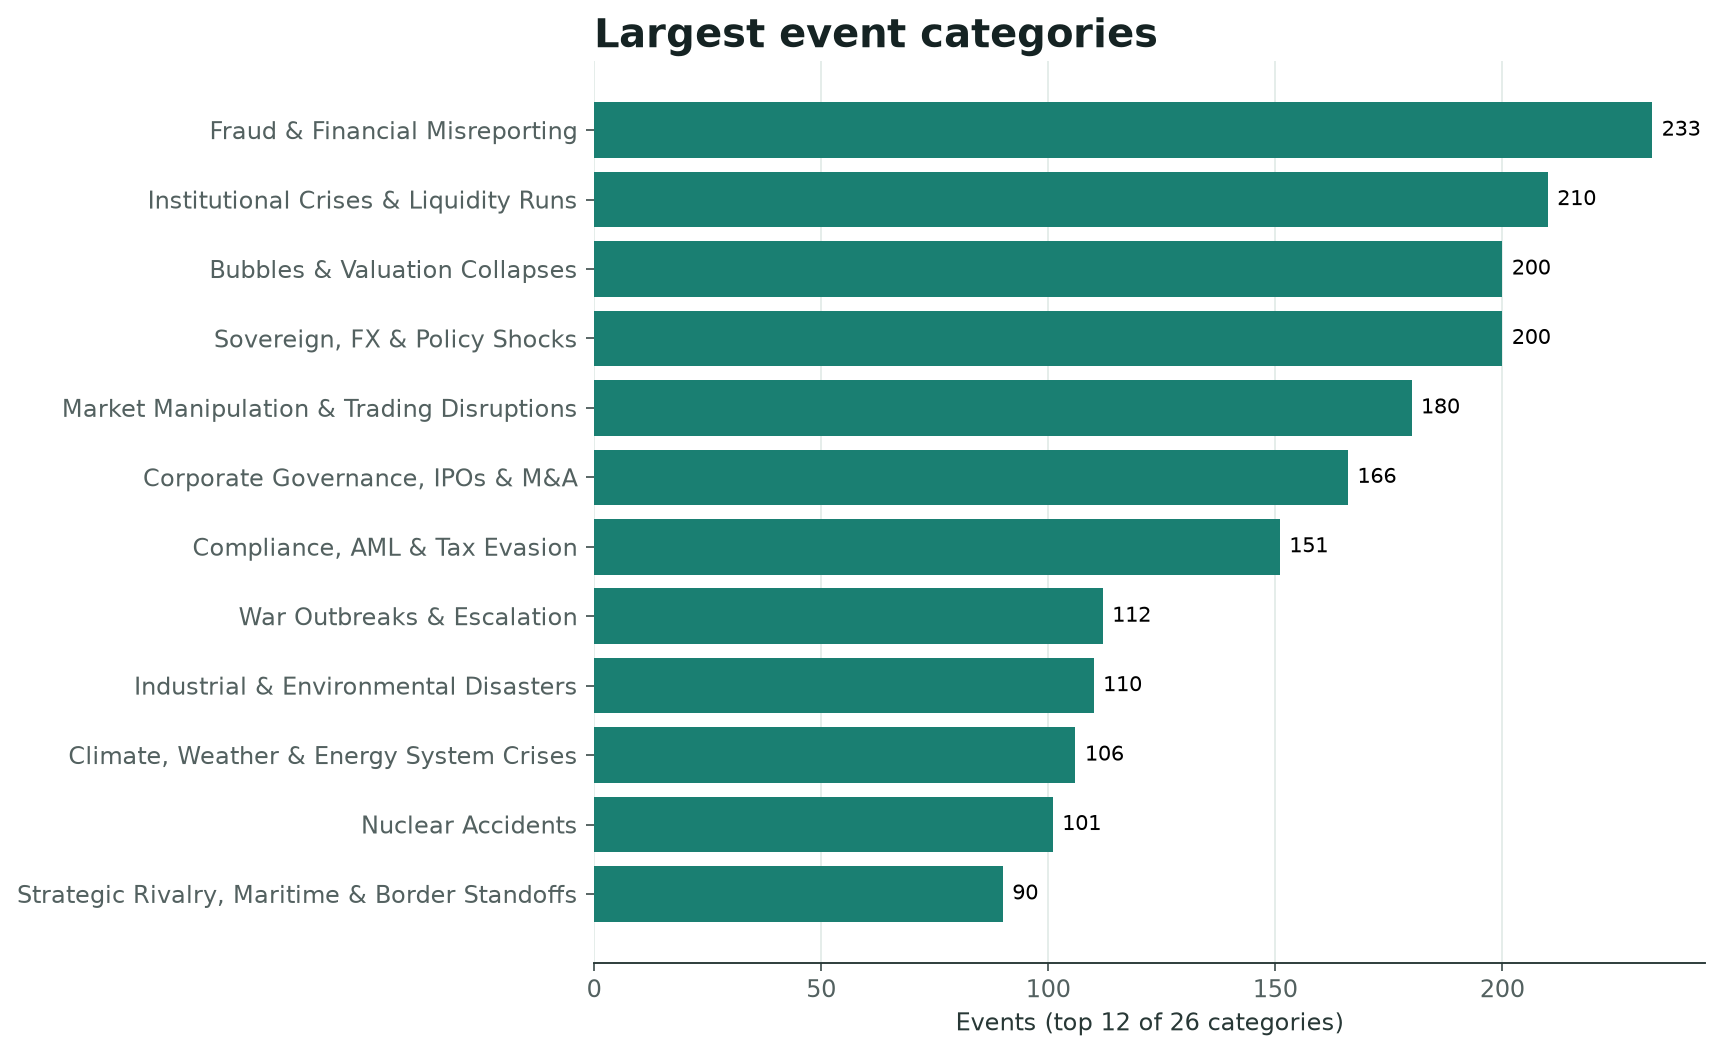
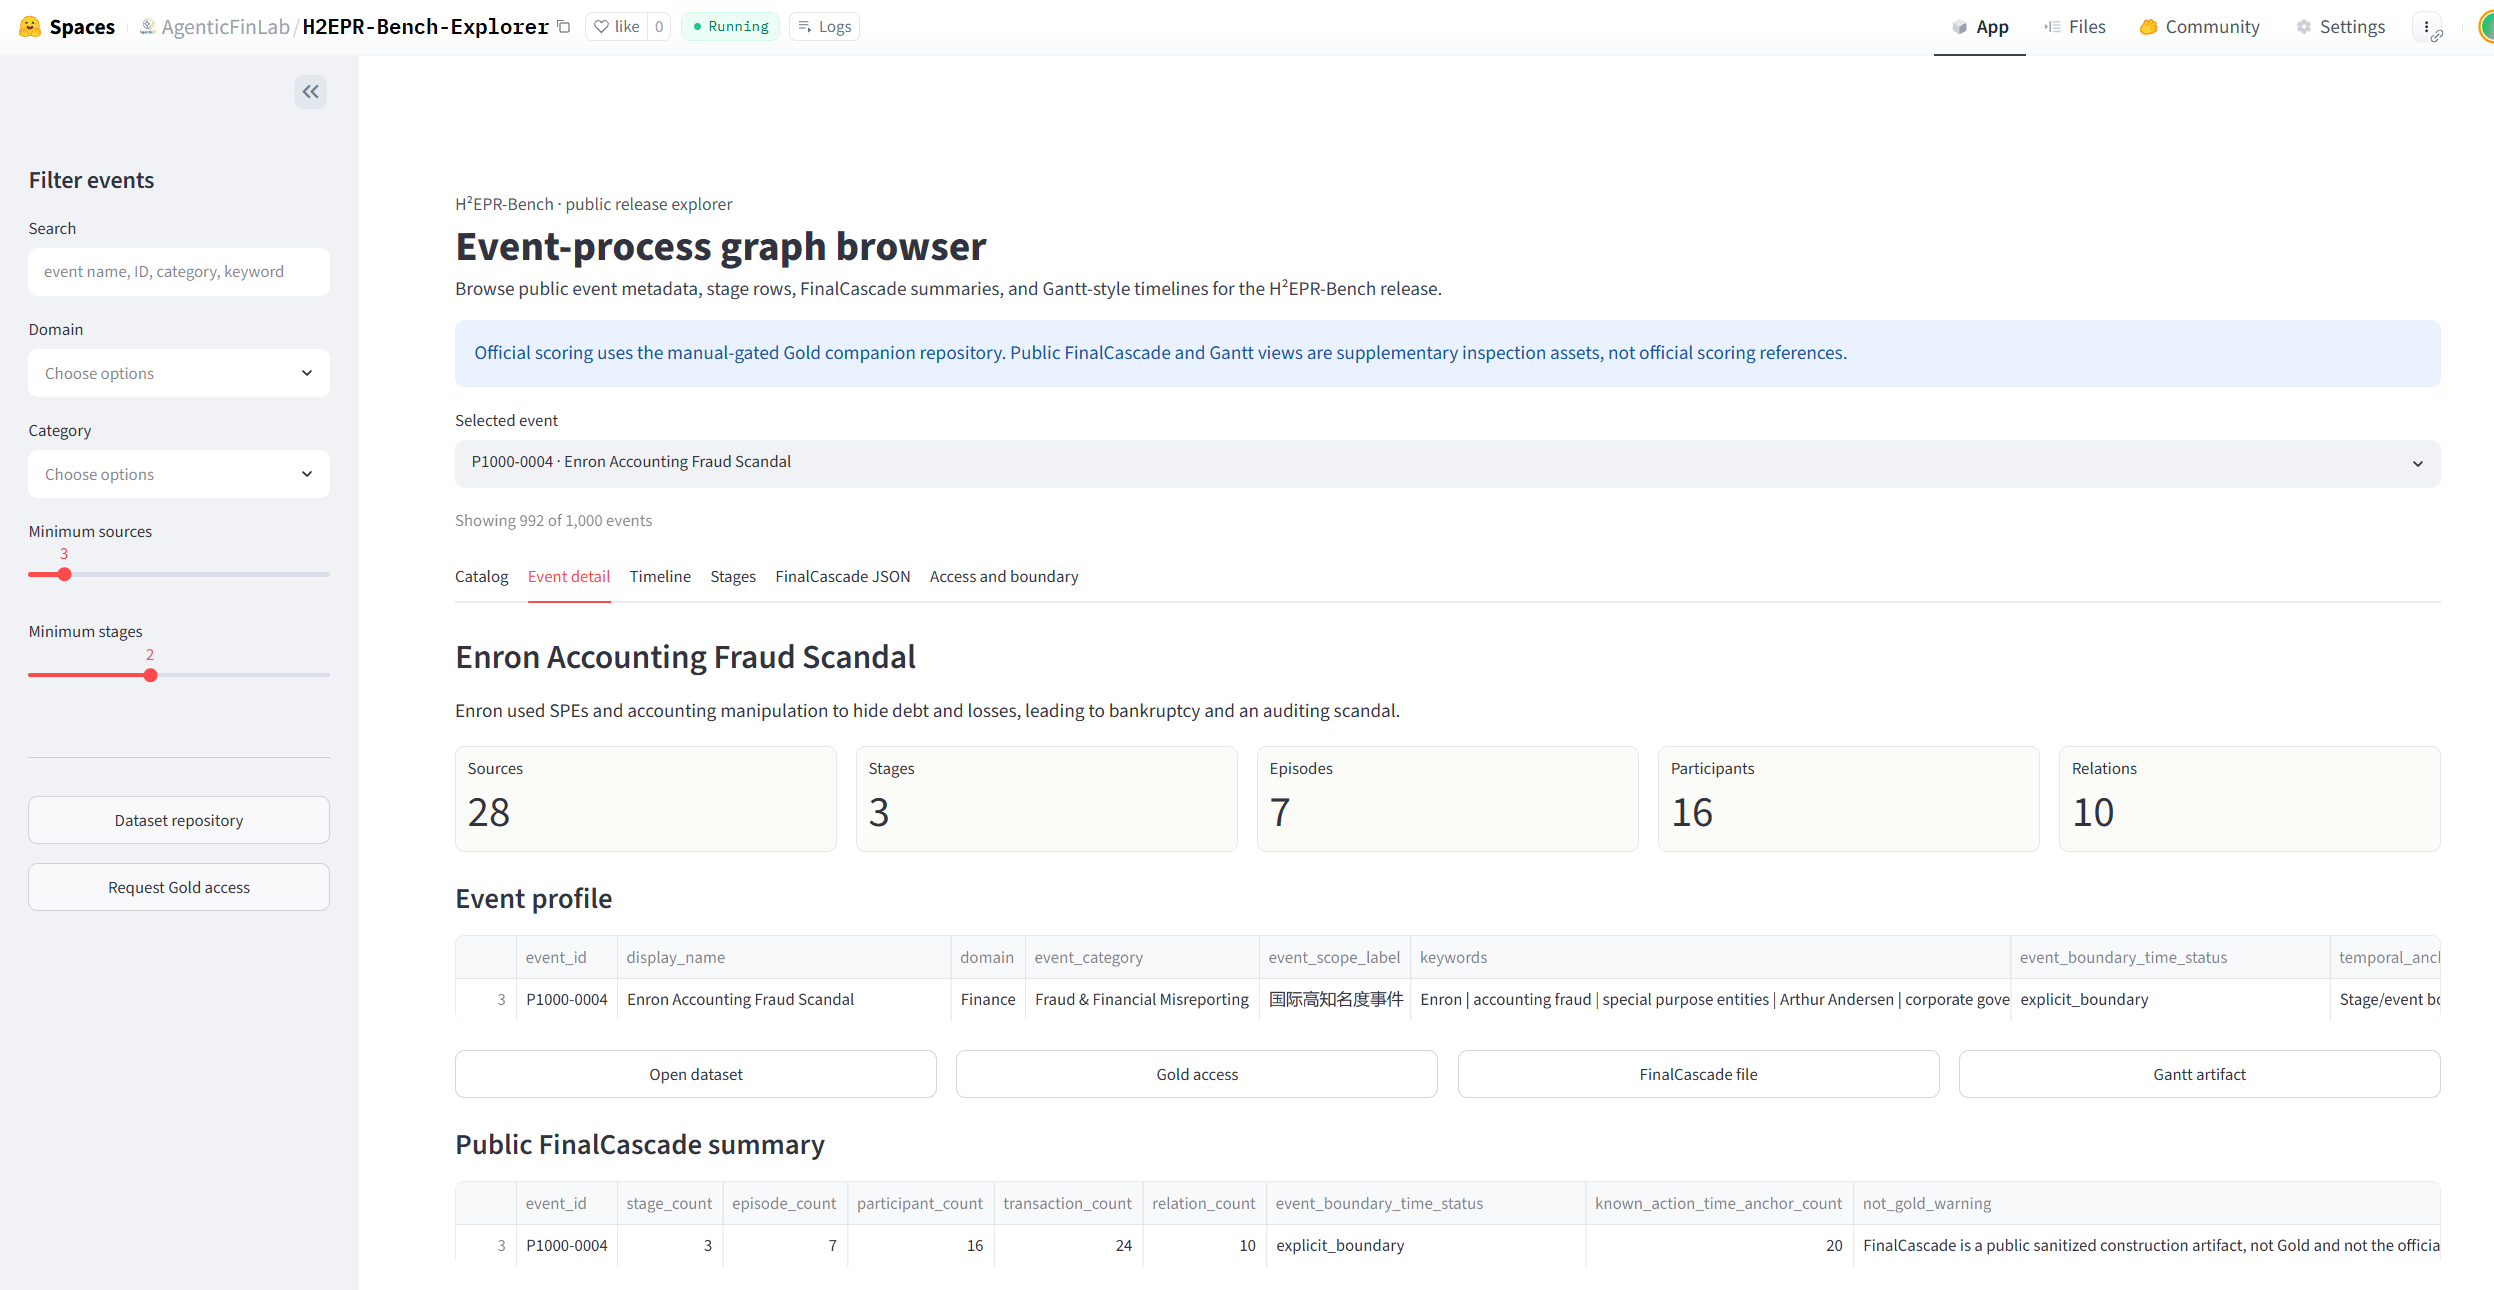
The Explorer is the browsing layer for event metadata, stage tables, timeline views, and public graph summaries.
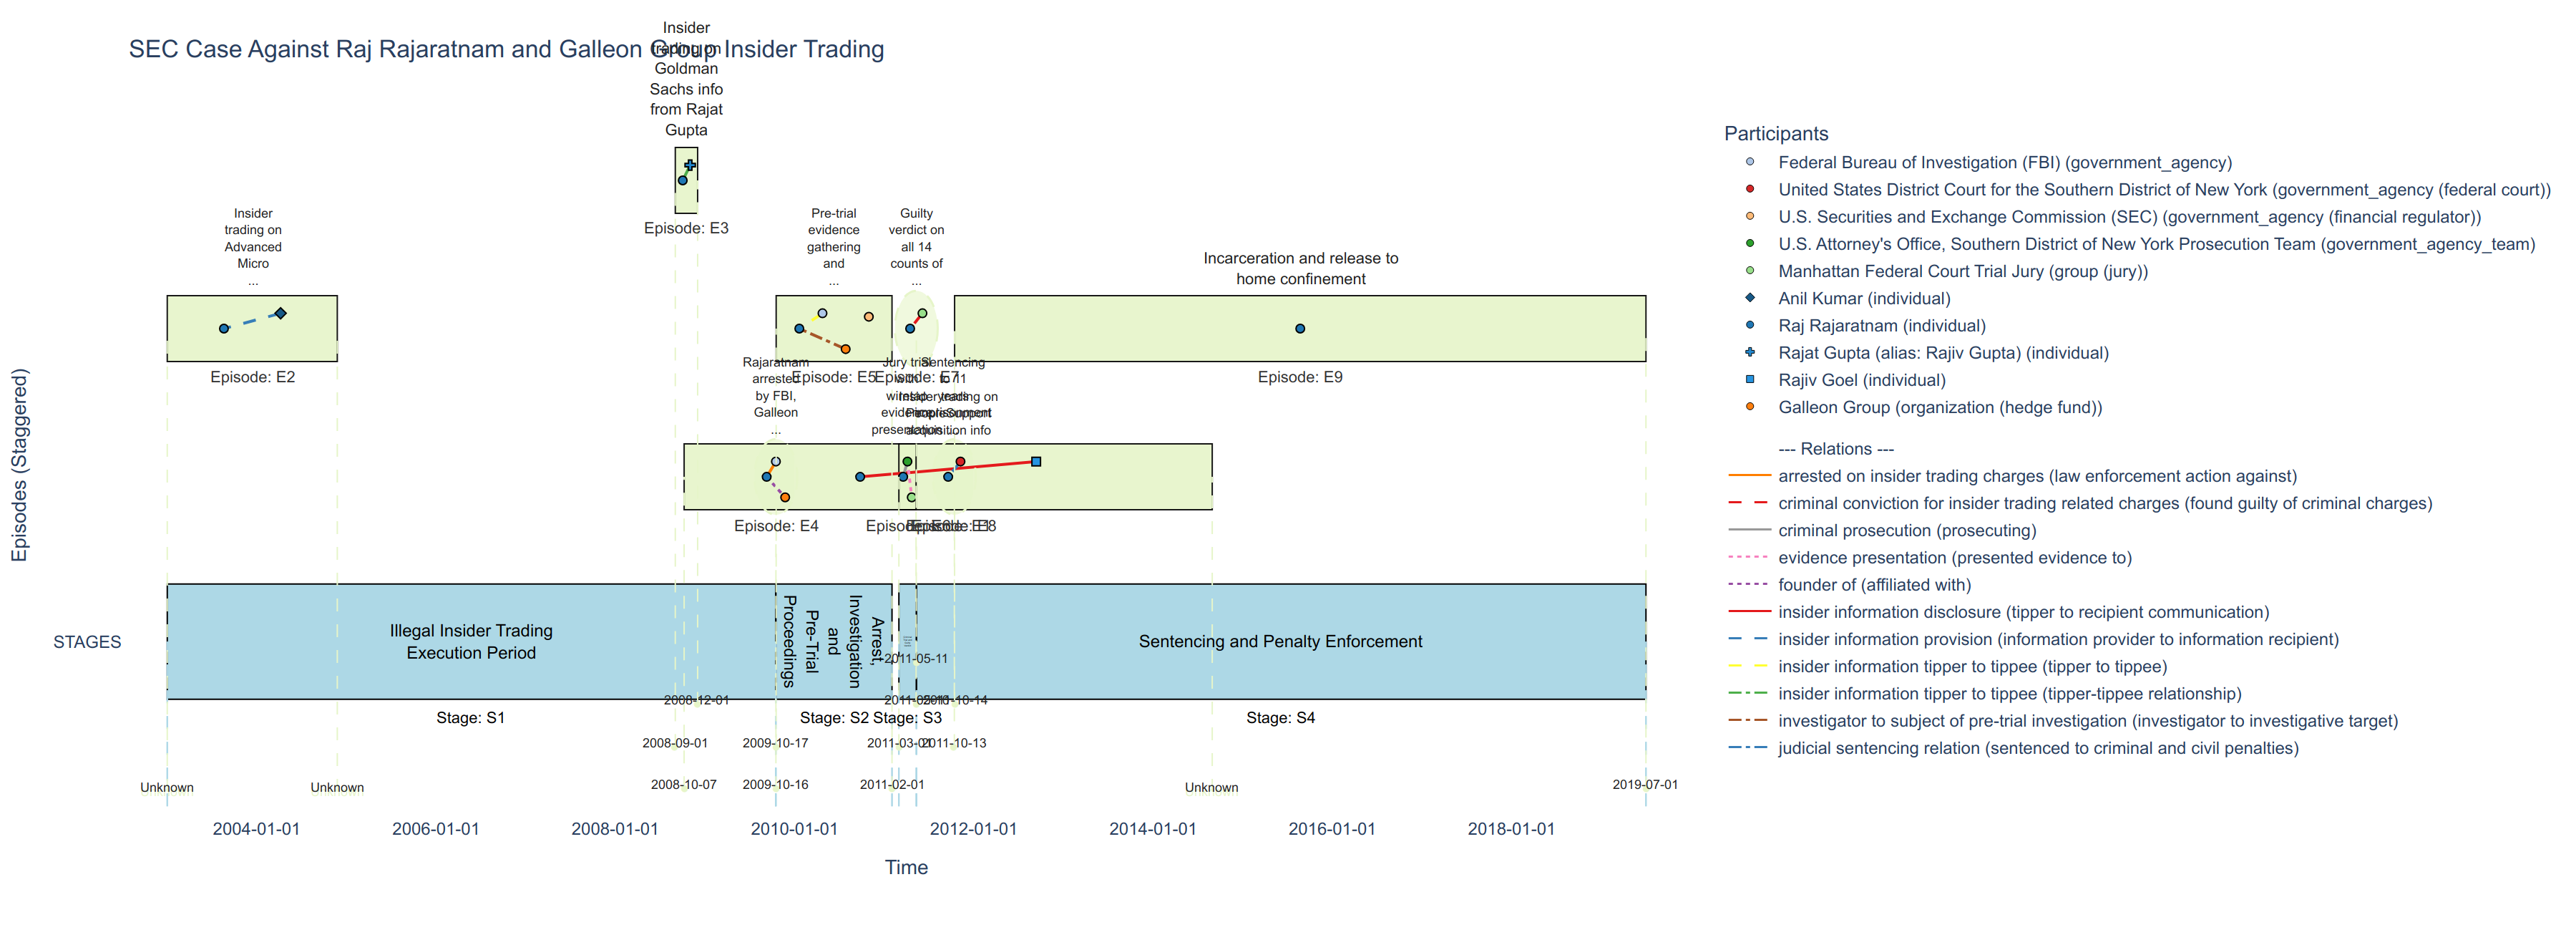
Representative FinMycelium Draft-EPG timelines from the 3,000-event collection.
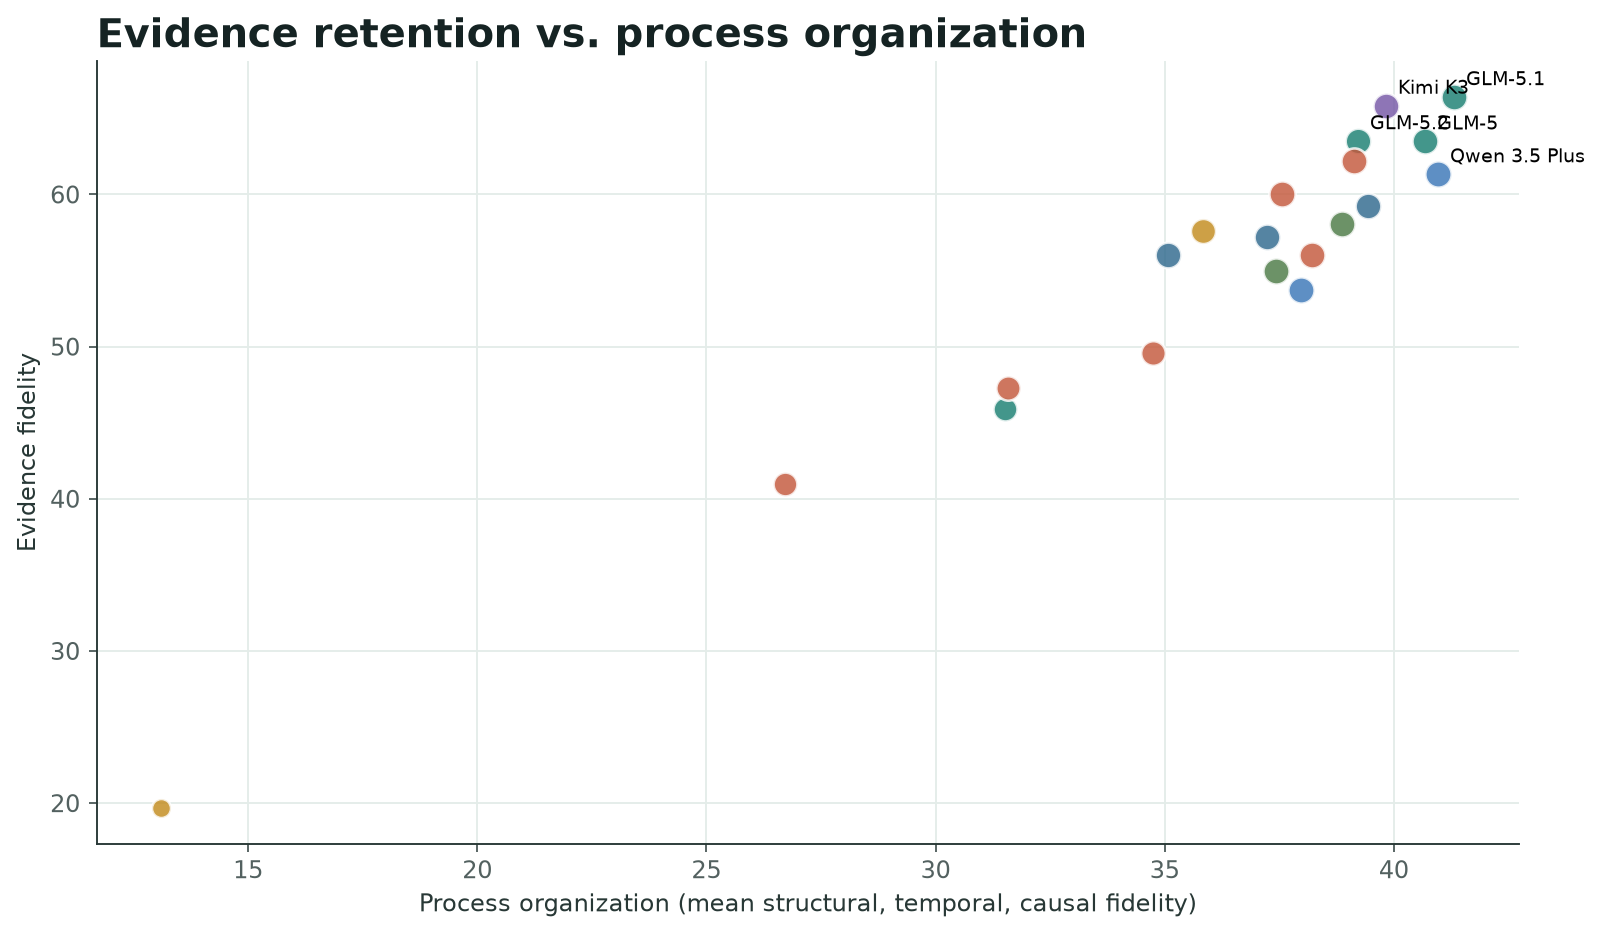
Direct reconstruction results expose a consistent gap between evidence retention and structured event-process recovery.
Each system receives the same event descriptor and evidence context.
The model returns a hierarchical heterogeneous event-process graph.
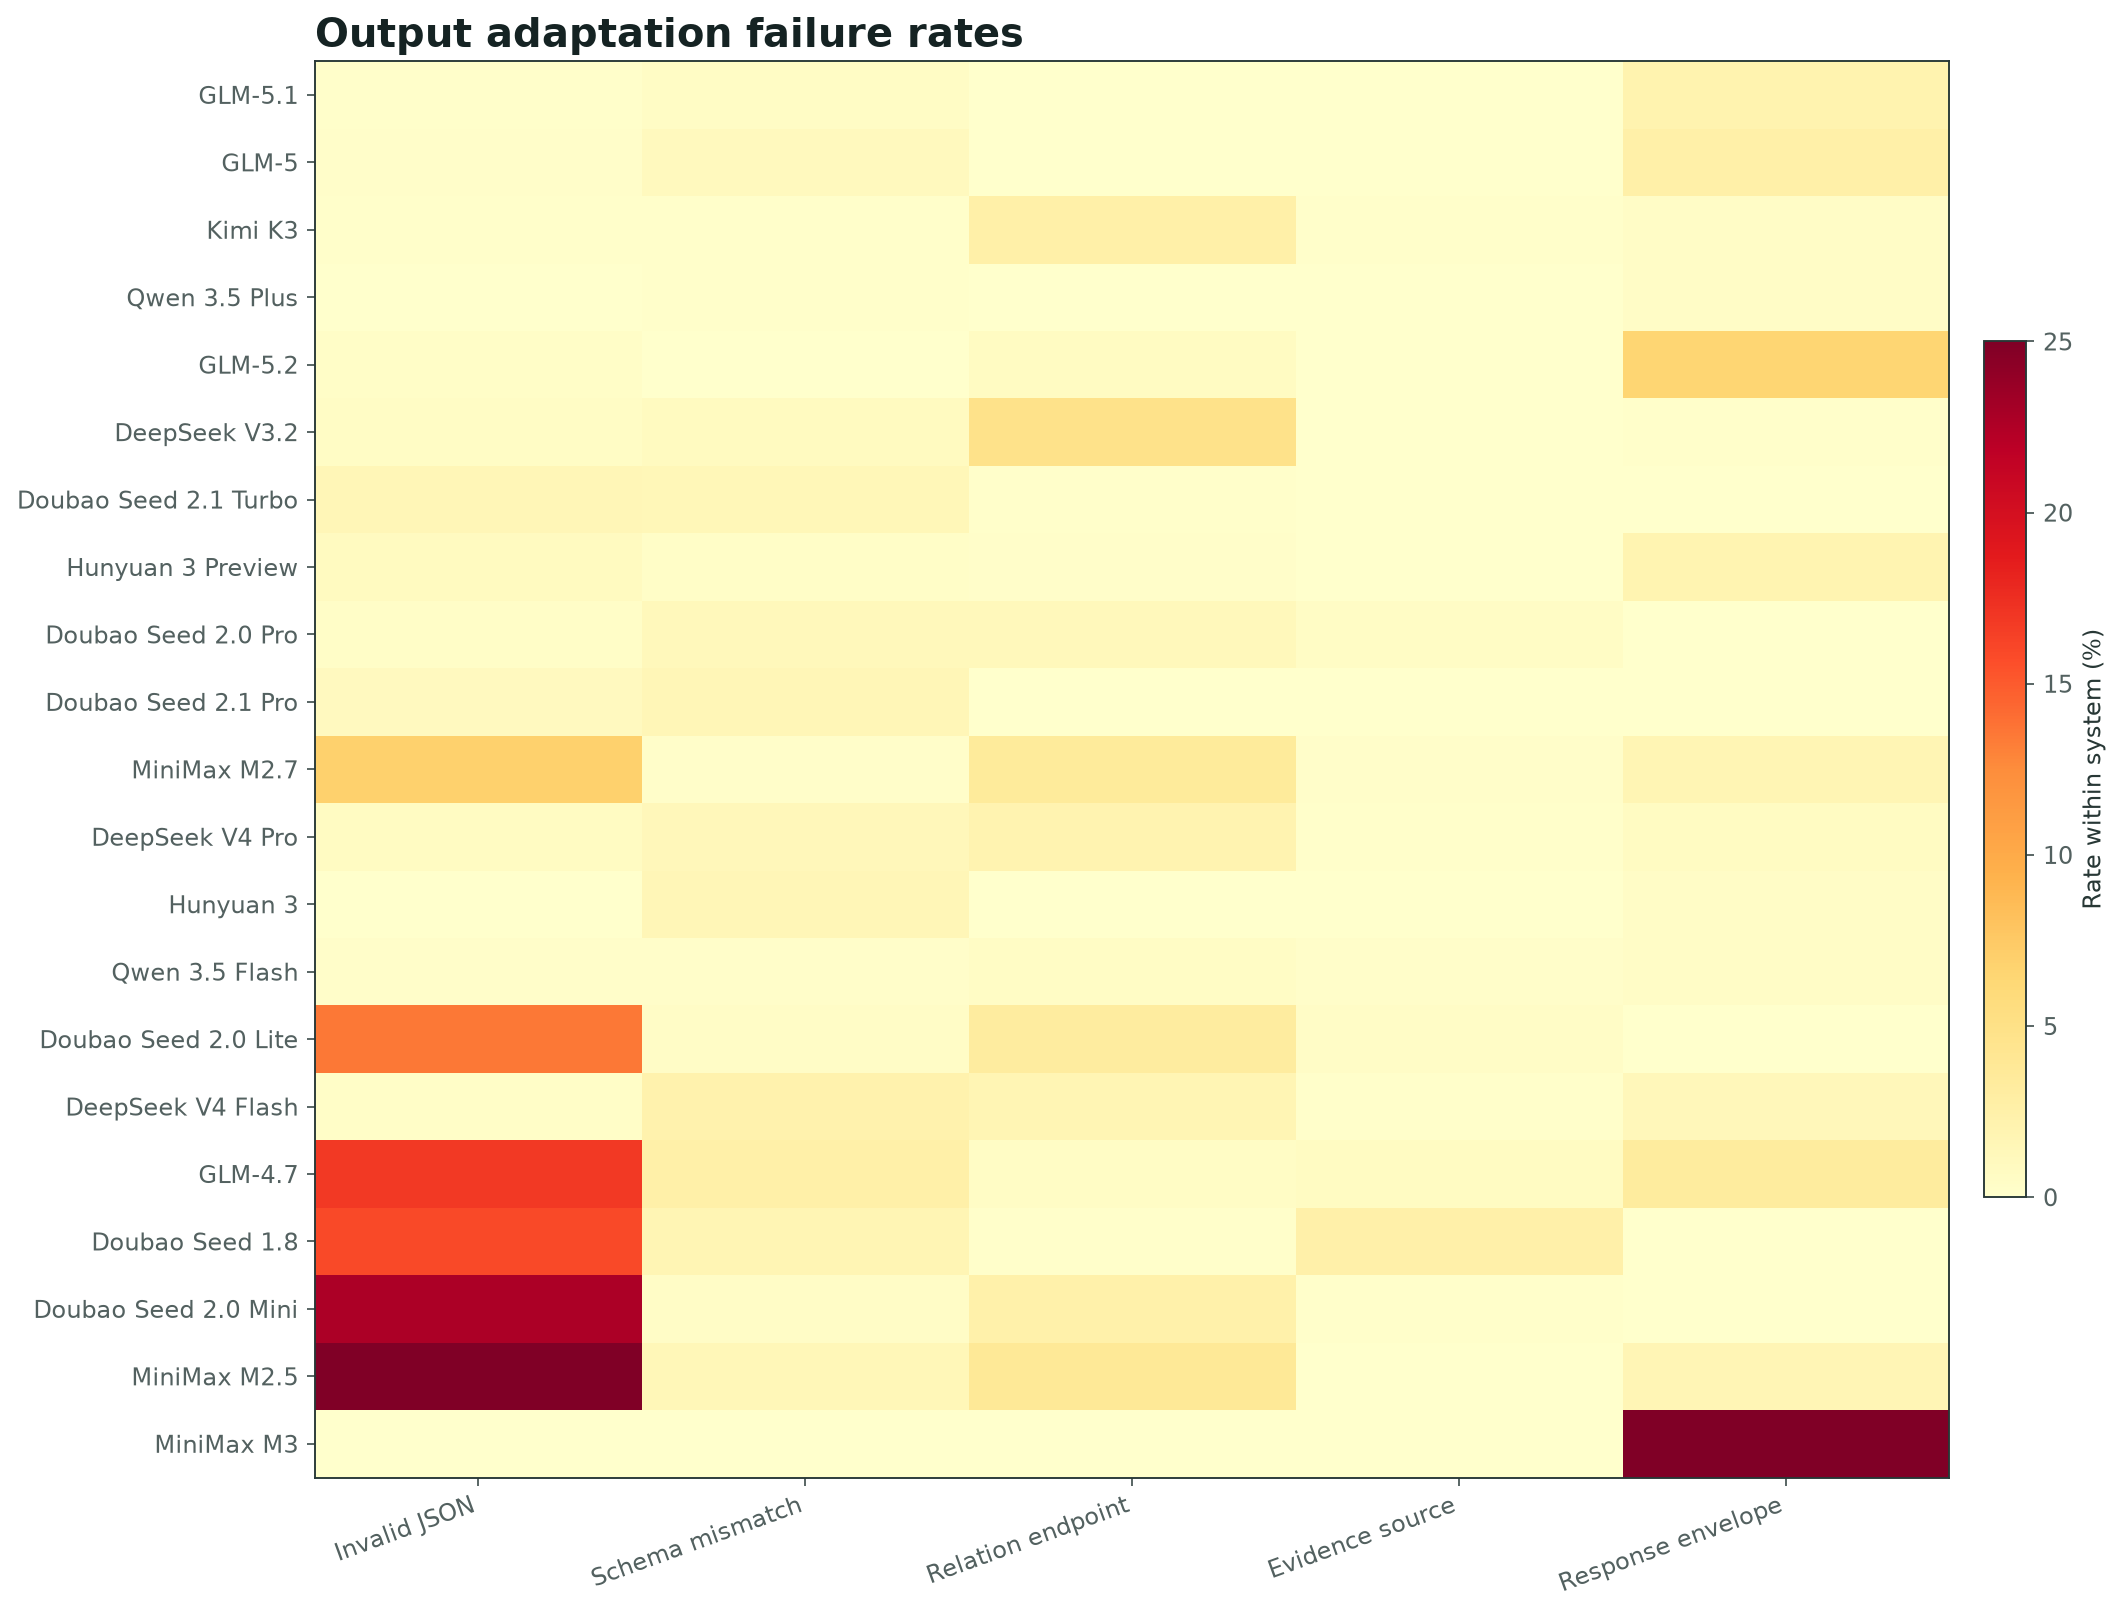
Every benchmark instance contributes to the official score after schema normalization.
Outputs are aligned with expert-finalized reference EPGs.
Scores separate structural, temporal, causal, and evidence fidelity.
Each card summarizes one direct reconstruction baseline across the official score and diagnostic subscores.
Loading model diagnostics...
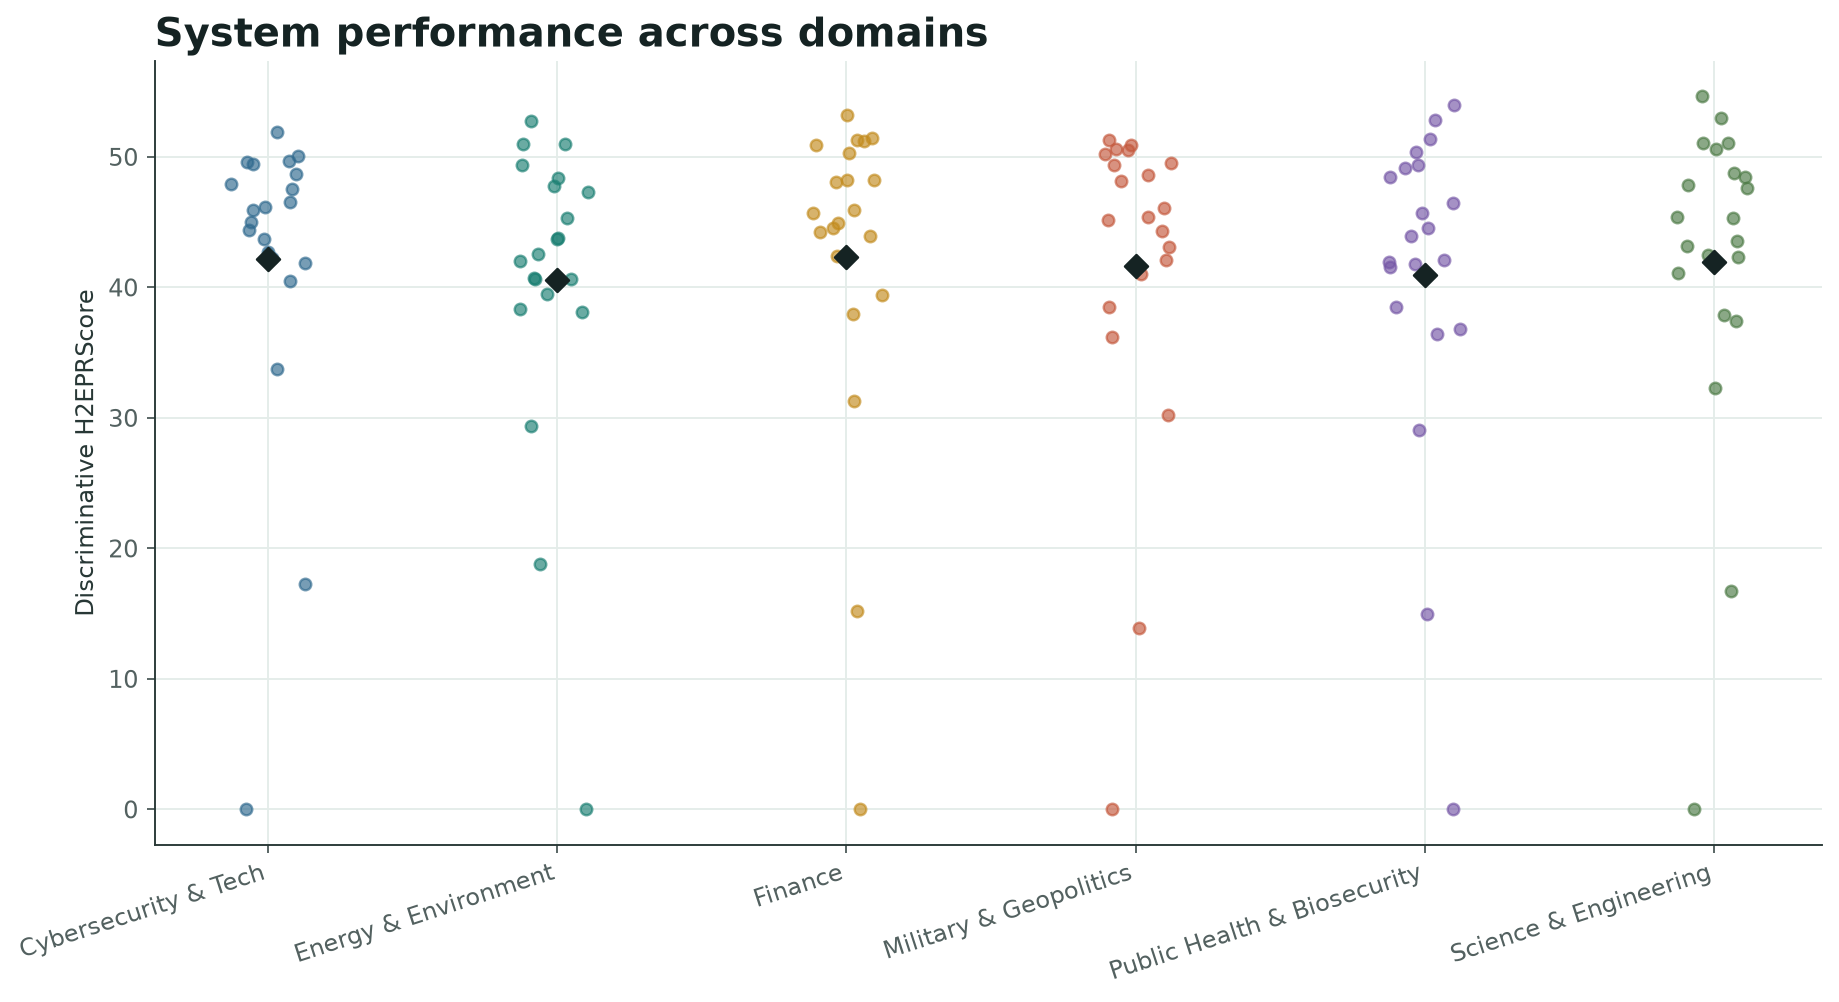
Instance-level spread anchors the diagnostic panel; aggregate readouts and companion checks sit beside and below it.
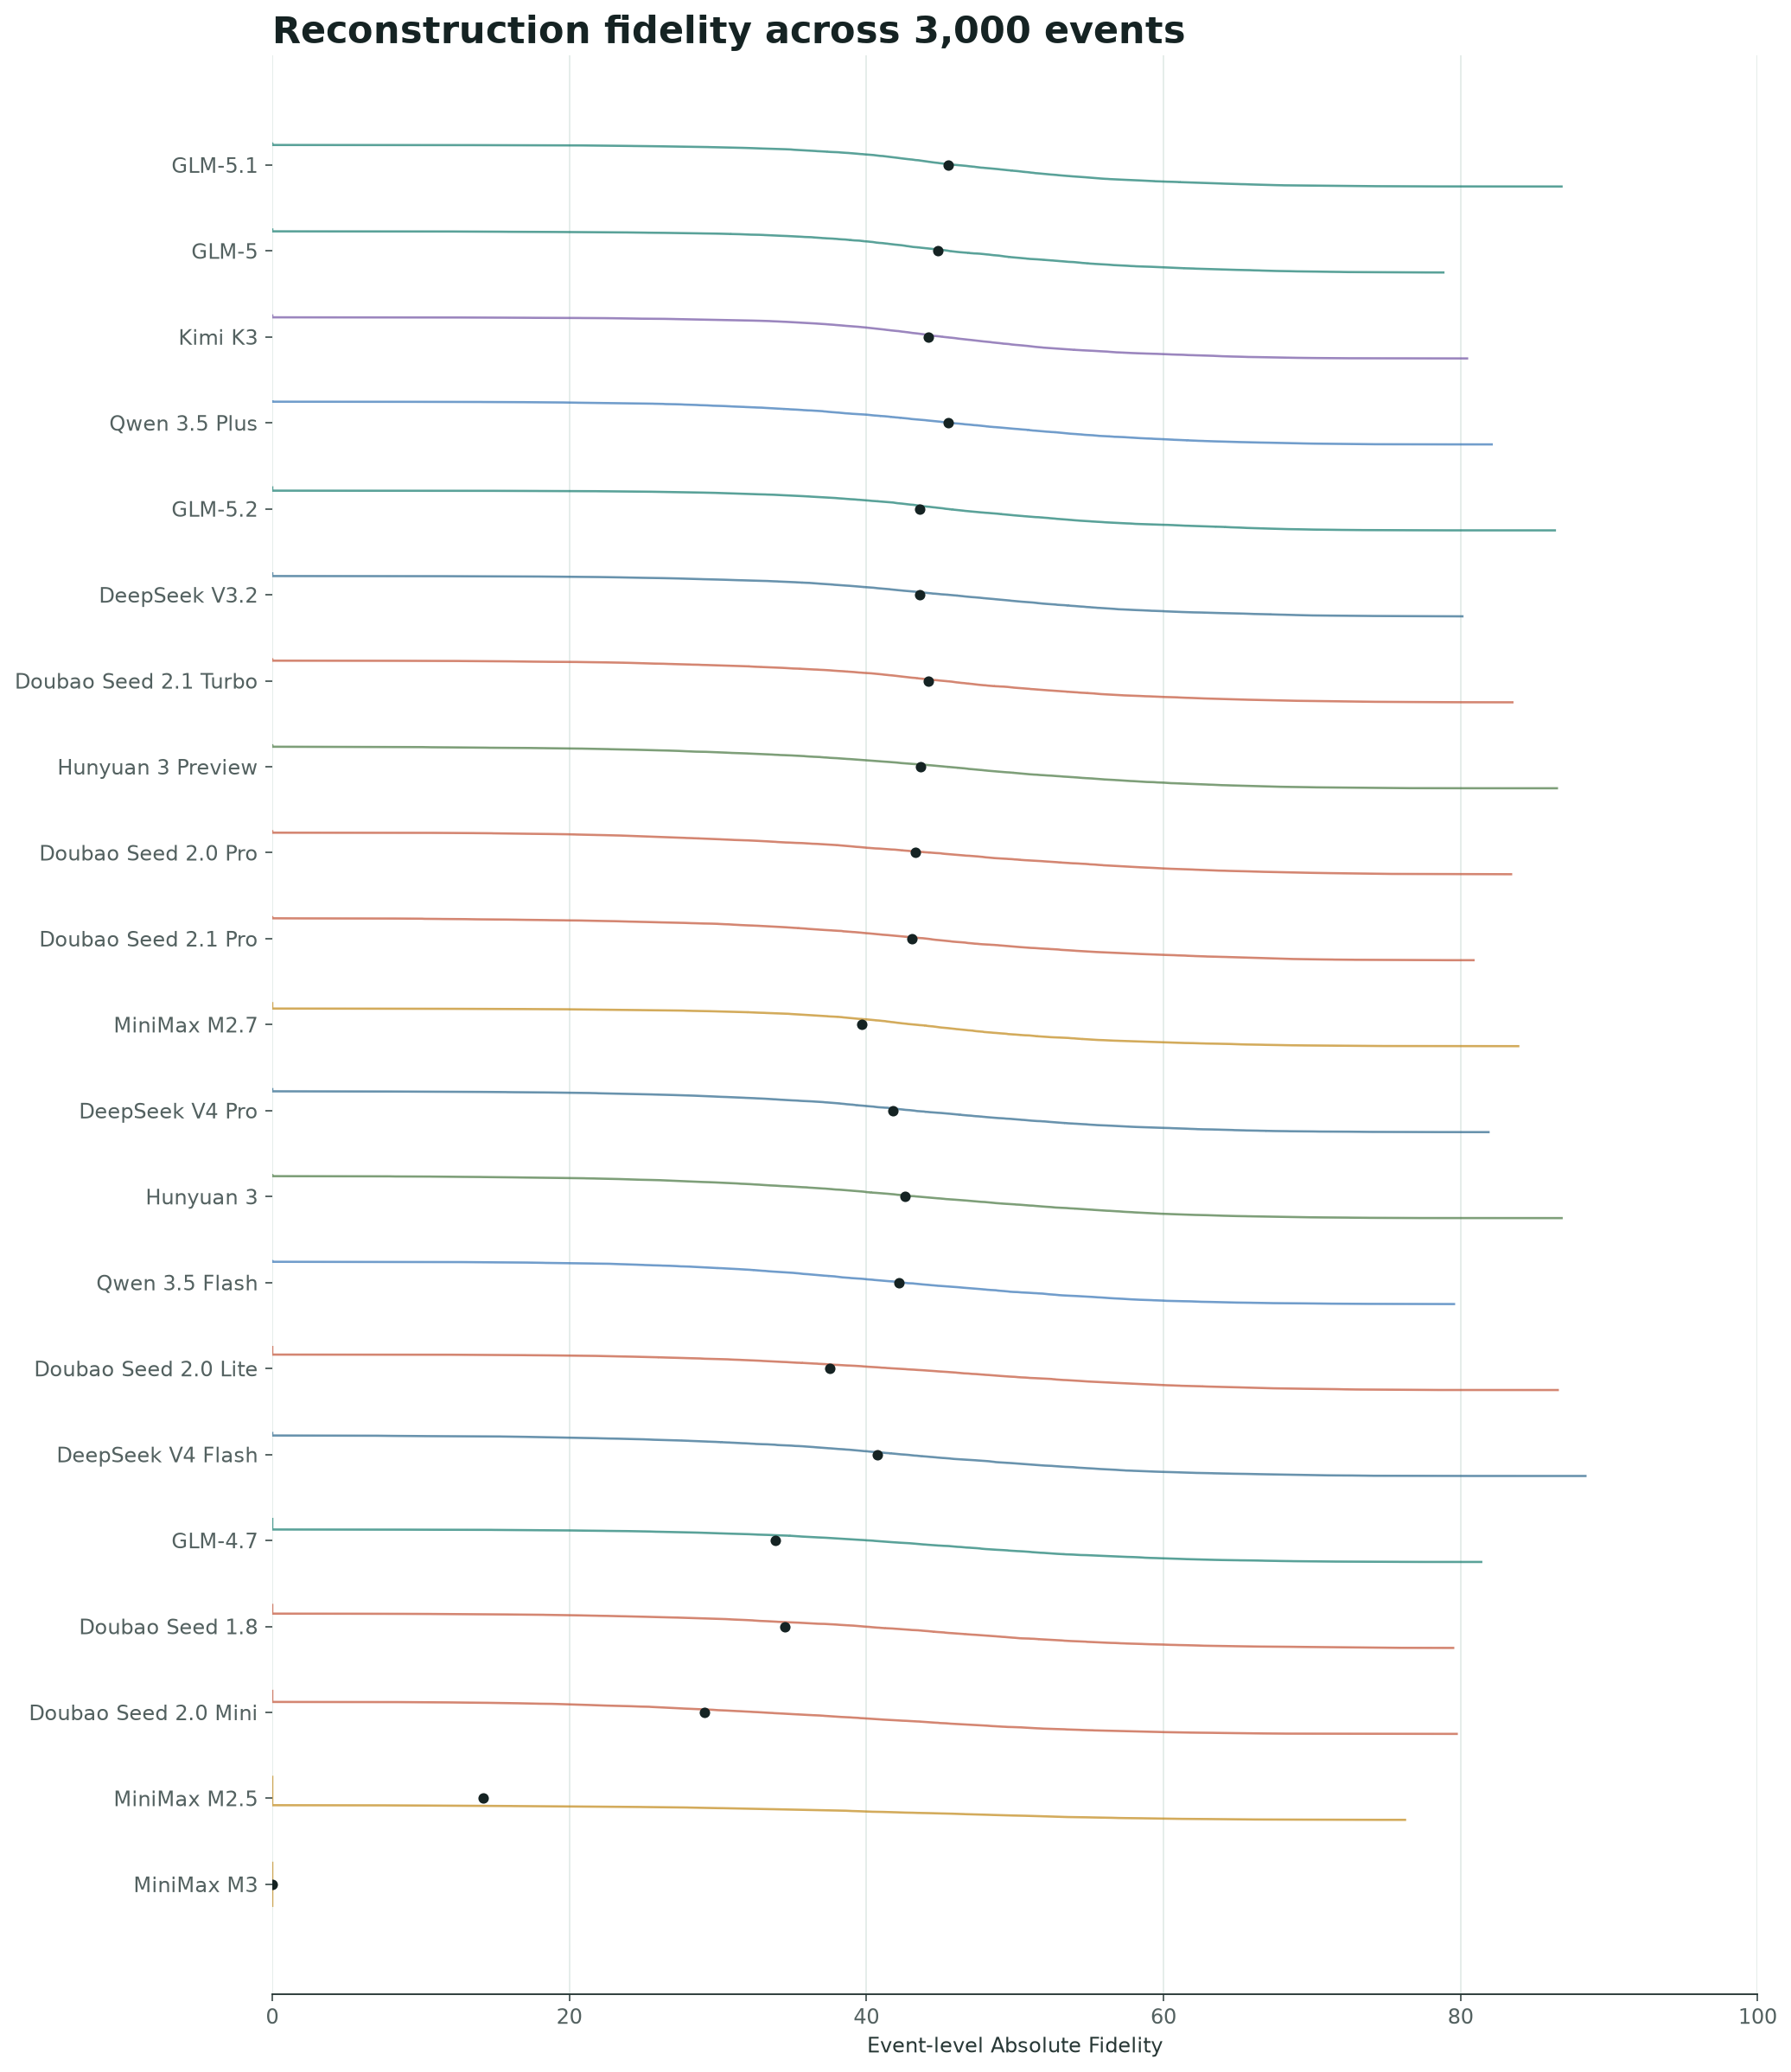
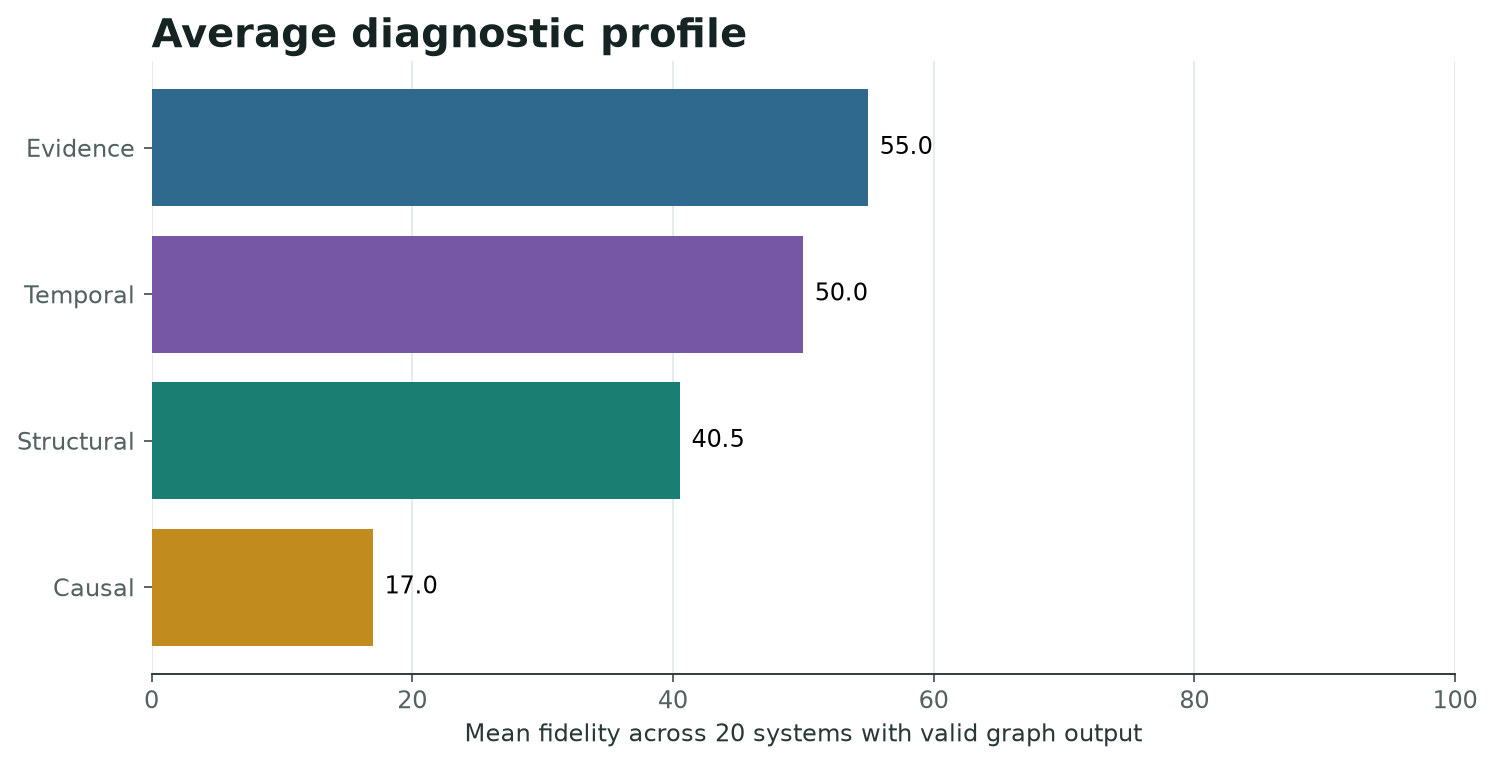
The mean fidelity profile separates source support from process reconstruction. Causal and mechanism recovery remains the most pronounced bottleneck.
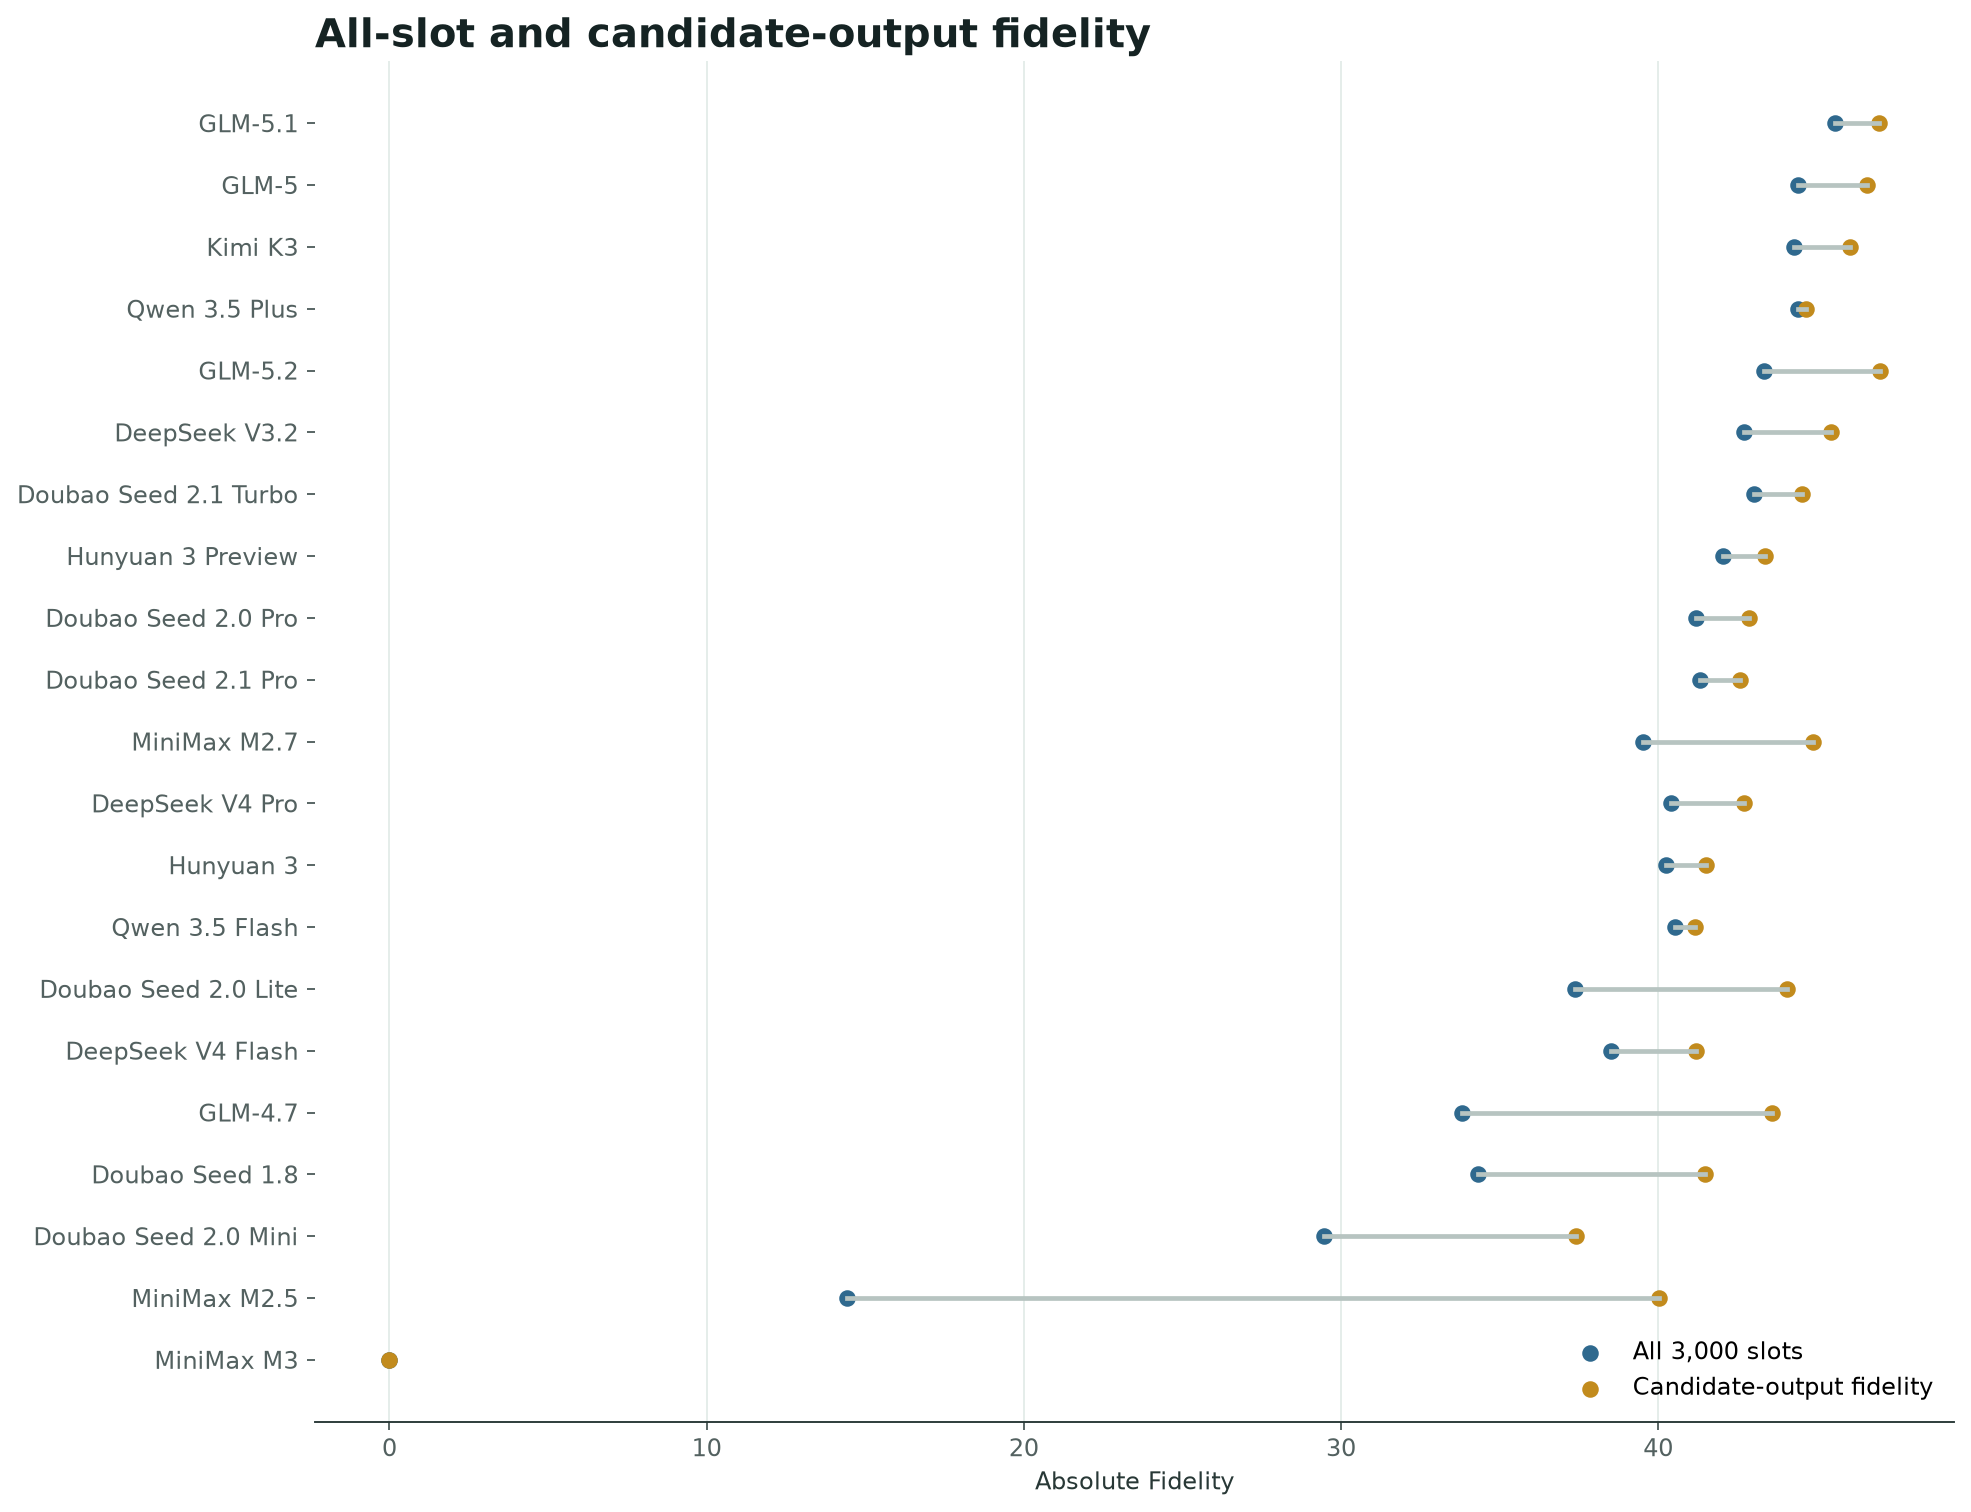
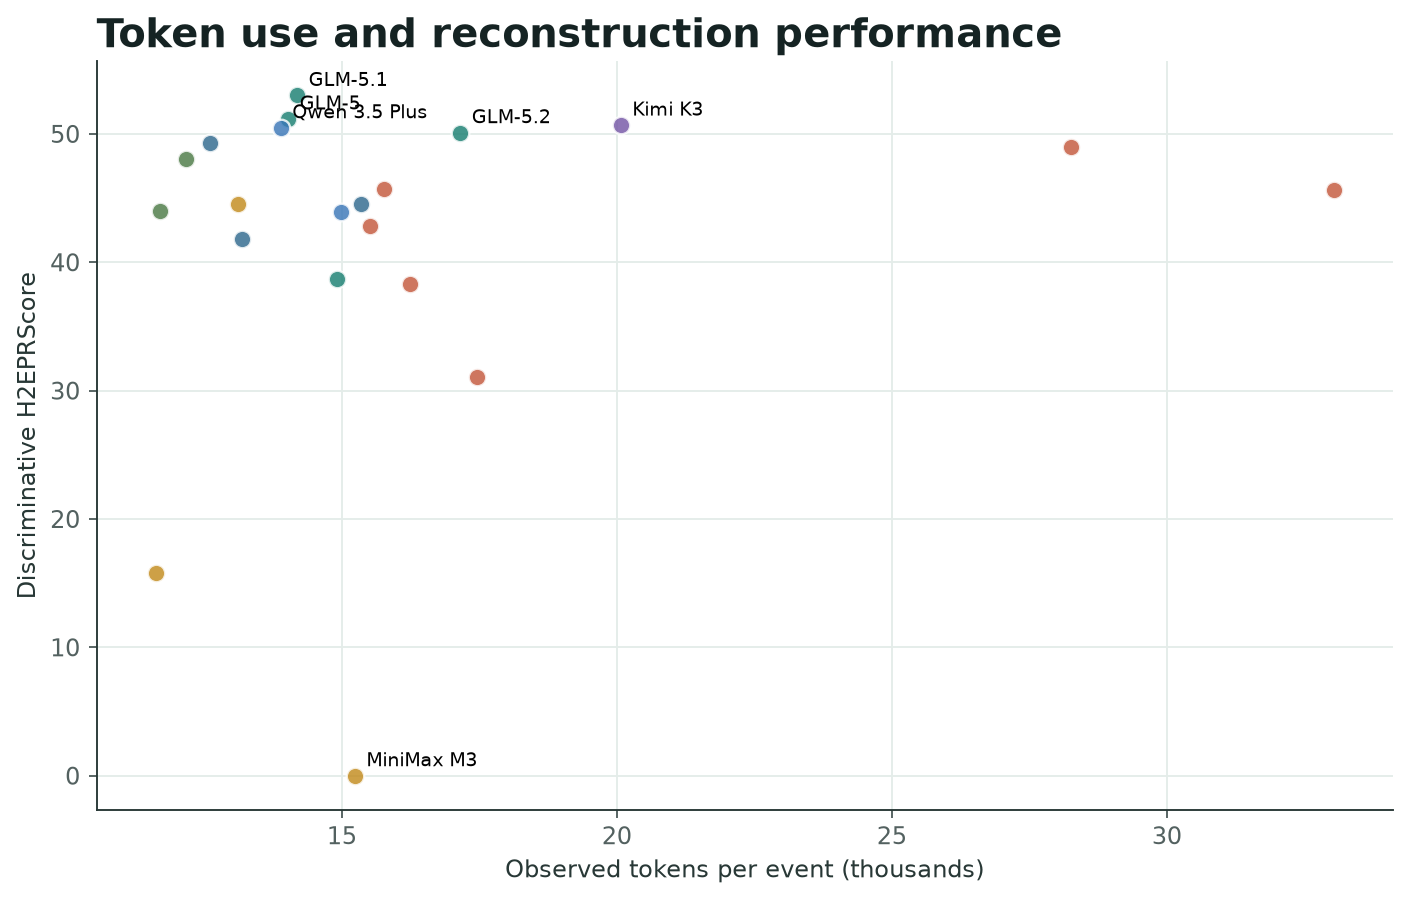
Sortable all-instance results for 21 direct reconstruction systems across 3,000 events.
| System | Valid outputs (%) | H²EPRScore | Absolute | Structure | Temporal | Causal | Evidence |
|---|---|---|---|---|---|---|---|
| Loading leaderboard data... | |||||||
@misc{h2eprbench2026,
  title = {H²EPR-Bench: An Evidence-Traceable Benchmark for Event-Process Reconstruction},
  author = {AgenticFinLab},
  year = {2026},
  note = {Forthcoming}
}